|
Download Data (XLS File) |
|
||||||||
|
||||||||
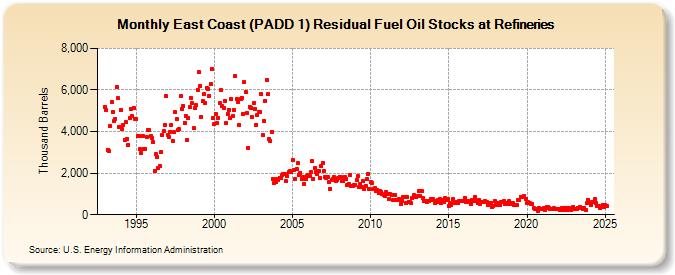
| East Coast (PADD 1) Residual Fuel Oil Stocks at Refineries (Thousand Barrels) | ||||||||
| Year | Jan | Feb | Mar | Apr | May | Jun | Jul | Aug | Sep | Oct | Nov | Dec |
|---|---|---|---|---|---|---|---|---|---|---|---|---|
| 1993 | 5,187 | 5,042 | 3,127 | 3,074 | 4,255 | 5,409 | 4,959 | 4,530 | 4,621 | 6,149 | 5,592 | 4,239 |
| 1994 | 5,047 | 4,116 | 4,293 | 3,595 | 4,445 | 3,645 | 3,367 | 4,650 | 5,090 | 4,741 | 5,144 | 4,617 |
| 1995 | 4,589 | 3,764 | 3,773 | 3,170 | 2,978 | 3,792 | 3,147 | 3,183 | 3,729 | 4,053 | 4,060 | 3,795 |
| 1996 | 3,666 | 3,479 | 2,114 | 2,904 | 2,788 | 2,245 | 2,323 | 3,017 | 3,858 | 4,004 | 4,311 | 5,693 |
| 1997 | 3,844 | 3,739 | 3,981 | 4,298 | 3,554 | 3,971 | 4,922 | 4,617 | 4,095 | 4,103 | 5,704 | 5,098 |
| 1998 | 5,232 | 4,419 | 4,767 | 3,593 | 4,628 | 5,176 | 5,626 | 5,358 | 4,169 | 5,117 | 5,272 | 6,020 |
| 1999 | 6,842 | 6,195 | 4,693 | 5,449 | 5,801 | 5,352 | 6,112 | 6,042 | 5,730 | 6,294 | 7,031 | 4,631 |
| 2000 | 4,357 | 4,823 | 4,392 | 4,652 | 5,354 | 5,976 | 5,208 | 5,130 | 5,459 | 4,389 | 4,859 | 5,054 |
| 2001 | 4,660 | 5,574 | 4,744 | 5,034 | 6,655 | 5,559 | 5,436 | 4,325 | 5,551 | 5,627 | 4,857 | 6,361 |
| 2002 | 5,898 | 4,901 | 3,228 | 5,197 | 5,138 | 4,706 | 5,373 | 5,081 | 4,330 | 4,802 | 4,941 | 4,931 |
| 2003 | 5,792 | 3,817 | 4,504 | 5,446 | 6,486 | 5,785 | 3,652 | 3,534 | 4,000 | 1,733 | 1,533 | 1,572 |
| 2004 | 1,723 | 1,688 | 1,789 | 1,786 | 1,902 | 1,982 | 1,967 | 1,604 | 1,840 | 2,054 | 2,085 | 2,036 |
| 2005 | 2,641 | 2,140 | 1,735 | 2,220 | 2,470 | 1,932 | 1,996 | 1,720 | 1,833 | 1,477 | 1,718 | 1,840 |
| 2006 | 1,908 | 1,859 | 2,038 | 2,577 | 1,736 | 2,254 | 2,078 | 1,937 | 2,115 | 1,769 | 2,332 | 2,511 |
| 2007 | 2,088 | 1,832 | 1,772 | 1,790 | 1,588 | 1,257 | 1,670 | 1,708 | 1,812 | 1,605 | 1,675 | 1,771 |
| 2008 | 1,834 | 1,824 | 1,617 | 1,627 | 1,818 | 1,719 | 1,453 | 1,489 | 1,914 | 1,383 | 1,399 | 1,437 |
| 2009 | 1,440 | 1,669 | 1,852 | 1,330 | 1,472 | 1,355 | 1,609 | 1,240 | 1,397 | 1,708 | 1,970 | 1,224 |
| 2010 | 1,561 | 1,528 | 1,215 | 1,277 | 1,146 | 1,199 | 1,021 | 1,152 | 1,097 | 985 | 966 | 920 |
| 2011 | 1,102 | 1,005 | 757 | 994 | 936 | 689 | 706 | 948 | 729 | 702 | 758 | 505 |
| 2012 | 682 | 852 | 828 | 561 | 846 | 624 | 628 | 544 | 789 | 930 | 874 | 841 |
| 2013 | 895 | 1,140 | 898 | 1,129 | 797 | 680 | 669 | 618 | 677 | 640 | 756 | 723 |
| 2014 | 736 | 541 | 665 | 596 | 717 | 767 | 541 | 700 | 602 | 780 | 729 | 761 |
| 2015 | 435 | 569 | 484 | 738 | 597 | 587 | 593 | 584 | 638 | 661 | 653 | 656 |
| 2016 | 809 | 606 | 638 | 665 | 621 | 507 | 717 | 672 | 831 | 681 | 578 | 689 |
| 2017 | 516 | 610 | 600 | 604 | 636 | 626 | 461 | 540 | 541 | 351 | 425 | 654 |
| 2018 | 564 | 448 | 565 | 451 | 598 | 609 | 654 | 504 | 562 | 501 | 645 | 520 |
| 2019 | 544 | 557 | 465 | 454 | 475 | 700 | 724 | 874 | 845 | 841 | 909 | 760 |
| 2020 | 566 | 598 | 547 | 495 | 510 | 301 | 272 | 266 | 193 | 344 | 254 | 256 |
| 2021 | 281 | 307 | 225 | 369 | 386 | 317 | 295 | 266 | 269 | 299 | 276 | 282 |
| 2022 | 271 | 238 | 282 | 338 | 228 | 311 | 311 | 228 | 301 | 297 | 241 | 367 |
| 2023 | 256 | 287 | 277 | 337 | 334 | 364 | 322 | 272 | 320 | 234 | 569 | 720 |
| 2024 | 541 | 456 | 589 | 593 | 739 | 555 | 433 | 407 | 315 | 395 | 481 | 382 |
| 2025 | 466 | 396 | 566 | 405 | ||||||||
| - = No Data Reported; -- = Not Applicable; NA = Not Available; W = Withheld to avoid disclosure of individual company data. |
| Release Date: 6/30/2025 |
| Next Release Date: 7/31/2025 |