|
Download Data (XLS File) |
|
||||||||
|
||||||||
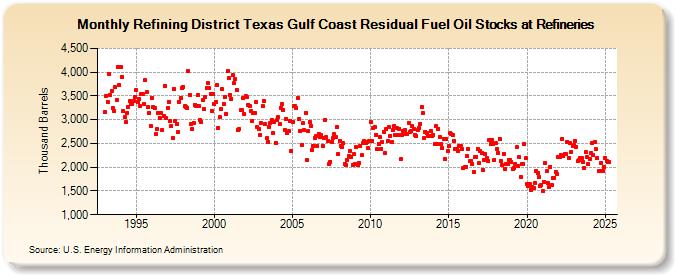
| Refining District Texas Gulf Coast Residual Fuel Oil Stocks at Refineries (Thousand Barrels) | ||||||||
| Year | Jan | Feb | Mar | Apr | May | Jun | Jul | Aug | Sep | Oct | Nov | Dec |
|---|---|---|---|---|---|---|---|---|---|---|---|---|
| 1993 | 3,167 | 3,500 | 3,379 | 3,952 | 3,514 | 3,594 | 3,256 | 3,191 | 3,679 | 3,423 | 4,110 | 3,720 |
| 1994 | 4,098 | 3,905 | 3,173 | 3,047 | 2,948 | 3,138 | 3,268 | 3,385 | 3,326 | 3,338 | 3,391 | 3,484 |
| 1995 | 3,617 | 3,377 | 3,439 | 3,281 | 3,536 | 3,537 | 3,338 | 3,827 | 3,580 | 3,274 | 3,148 | 2,874 |
| 1996 | 3,465 | 3,277 | 3,246 | 2,696 | 2,798 | 3,137 | 3,036 | 3,141 | 2,779 | 3,079 | 3,705 | 3,025 |
| 1997 | 3,244 | 3,379 | 2,979 | 2,864 | 2,617 | 3,652 | 2,982 | 2,912 | 2,745 | 3,377 | 3,464 | 3,657 |
| 1998 | 3,698 | 3,278 | 3,276 | 3,254 | 4,017 | 3,523 | 2,907 | 2,799 | 2,940 | 3,309 | 3,288 | 3,512 |
| 1999 | 3,280 | 2,983 | 2,948 | 3,411 | 3,218 | 3,476 | 3,675 | 3,769 | 3,660 | 3,545 | 3,187 | 3,546 |
| 2000 | 3,323 | 3,381 | 3,735 | 2,825 | 3,050 | 3,219 | 3,643 | 3,338 | 3,473 | 3,129 | 4,023 | 3,872 |
| 2001 | 3,518 | 3,439 | 3,939 | 3,765 | 3,850 | 3,634 | 2,793 | 2,805 | 3,196 | 3,213 | 3,457 | 3,110 |
| 2002 | 3,498 | 3,473 | 3,319 | 3,290 | 3,179 | 2,972 | 3,142 | 3,149 | 3,373 | 2,846 | 2,807 | 2,669 |
| 2003 | 2,932 | 3,281 | 3,399 | 2,902 | 2,608 | 2,535 | 2,856 | 2,933 | 2,991 | 2,712 | 2,950 | 2,504 |
| 2004 | 2,983 | 3,054 | 2,905 | 3,249 | 3,321 | 3,202 | 2,791 | 3,021 | 2,713 | 2,753 | 2,979 | 2,347 |
| 2005 | 2,959 | 3,284 | 3,278 | 3,244 | 3,457 | 3,017 | 2,771 | 2,464 | 2,920 | 2,781 | 3,150 | 2,144 |
| 2006 | 2,758 | 2,961 | 2,877 | 2,361 | 2,455 | 2,617 | 2,664 | 2,449 | 2,700 | 2,627 | 2,672 | 2,455 |
| 2007 | 2,616 | 2,994 | 2,626 | 2,561 | 2,072 | 2,117 | 2,537 | 2,604 | 2,690 | 2,634 | 2,841 | 2,282 |
| 2008 | 2,548 | 2,450 | 2,430 | 2,503 | 2,073 | 2,051 | 2,153 | 2,234 | 2,336 | 2,209 | 2,043 | 2,282 |
| 2009 | 2,064 | 2,415 | 2,053 | 2,094 | 2,452 | 2,250 | 2,511 | 2,549 | 2,507 | 2,521 | 2,396 | 2,543 |
| 2010 | 2,956 | 2,557 | 2,833 | 2,847 | 2,680 | 2,373 | 2,496 | 2,632 | 2,389 | 2,528 | 2,750 | 2,294 |
| 2011 | 2,810 | 2,556 | 2,844 | 2,662 | 2,522 | 2,779 | 2,872 | 2,678 | 2,824 | 2,680 | 2,809 | 2,169 |
| 2012 | 2,681 | 2,763 | 2,779 | 2,701 | 2,694 | 2,937 | 2,746 | 2,767 | 2,861 | 2,799 | 2,683 | 2,655 |
| 2013 | 2,779 | 2,815 | 2,913 | 3,267 | 3,143 | 2,624 | 2,750 | 2,728 | 2,660 | 2,666 | 2,770 | 2,666 |
| 2014 | 2,679 | 2,493 | 2,858 | 2,494 | 2,809 | 2,641 | 2,489 | 2,400 | 2,591 | 2,172 | 2,594 | 2,341 |
| 2015 | 2,445 | 2,720 | 2,693 | 2,667 | 2,558 | 2,389 | 2,375 | 2,335 | 2,446 | 2,443 | 2,390 | 1,982 |
| 2016 | 1,996 | 2,002 | 2,235 | 2,388 | 2,122 | 2,137 | 2,066 | 1,903 | 2,211 | 2,223 | 2,383 | 2,082 |
| 2017 | 2,336 | 2,296 | 1,946 | 2,157 | 2,270 | 2,202 | 2,121 | 2,569 | 2,495 | 2,581 | 2,486 | 2,158 |
| 2018 | 2,501 | 2,392 | 2,295 | 2,595 | 2,136 | 2,040 | 2,283 | 1,967 | 2,066 | 2,059 | 2,157 | 2,149 |
| 2019 | 2,111 | 1,960 | 1,986 | 2,066 | 2,417 | 2,027 | 2,209 | 1,796 | 2,075 | 2,073 | 2,486 | 2,183 |
| 2020 | 1,638 | 1,609 | 1,652 | 1,528 | 1,583 | 1,568 | 1,673 | 1,914 | 1,868 | 1,792 | 1,612 | 1,615 |
| 2021 | 1,489 | 1,697 | 2,080 | 1,911 | 1,671 | 1,578 | 2,014 | 1,627 | 1,765 | 1,780 | 1,896 | 1,859 |
| 2022 | 2,219 | 2,211 | 2,256 | 2,602 | 2,230 | 2,274 | 2,270 | 2,534 | 2,197 | 2,508 | 2,327 | 2,455 |
| 2023 | 2,468 | 2,547 | 2,426 | 2,125 | 2,161 | 2,191 | 2,193 | 2,114 | 1,976 | 2,310 | 2,215 | 2,061 |
| 2024 | 2,172 | |||||||||||
| - = No Data Reported; -- = Not Applicable; NA = Not Available; W = Withheld to avoid disclosure of individual company data. |
| Release Date: 3/29/2024 |
| Next Release Date: 4/30/2024 |
Referring Pages: