|
Download Data (XLS File) |
|
||||||||
|
||||||||
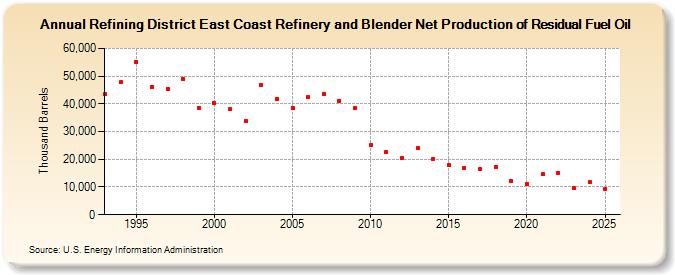
| Refining District East Coast Refinery and Blender Net Production of Residual Fuel Oil (Thousand Barrels) | ||||||||
| Decade | Year-0 | Year-1 | Year-2 | Year-3 | Year-4 | Year-5 | Year-6 | Year-7 | Year-8 | Year-9 |
|---|---|---|---|---|---|---|---|---|---|---|
| 1990's | 43,455 | 47,704 | 55,124 | 46,166 | 45,494 | 49,002 | 38,556 | |||
| 2000's | 40,252 | 37,998 | 33,894 | 46,967 | 41,862 | 38,624 | 42,505 | 43,618 | 41,127 | 38,544 |
| 2010's | 25,076 | 22,580 | 20,460 | 24,005 | 20,154 | 17,858 | 16,910 | 16,330 | 17,275 | 12,155 |
| 2020's | 11,136 | 14,562 | 15,060 | 9,626 |
| - = No Data Reported; -- = Not Applicable; NA = Not Available; W = Withheld to avoid disclosure of individual company data. |
| Release Date: 6/28/2024 |
| Next Release Date: 8/30/2024 |