|
Download Data (XLS File) |
|
||||||||
|
||||||||
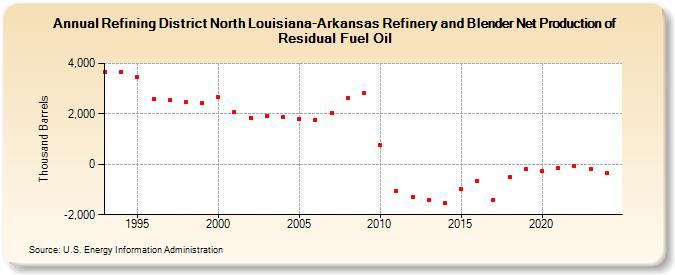
| Refining District North Louisiana-Arkansas Refinery and Blender Net Production of Residual Fuel Oil (Thousand Barrels) | ||||||||
| Decade | Year-0 | Year-1 | Year-2 | Year-3 | Year-4 | Year-5 | Year-6 | Year-7 | Year-8 | Year-9 |
|---|---|---|---|---|---|---|---|---|---|---|
| 1990's | 3,665 | 3,654 | 3,448 | 2,596 | 2,548 | 2,471 | 2,439 | |||
| 2000's | 2,654 | 2,083 | 1,856 | 1,923 | 1,895 | 1,814 | 1,758 | 2,055 | 2,642 | 2,835 |
| 2010's | 749 | -1,062 | -1,310 | -1,408 | -1,545 | -984 | -656 | -1,411 | -516 | -180 |
| 2020's | -273 | -144 | -75 | -203 |
| - = No Data Reported; -- = Not Applicable; NA = Not Available; W = Withheld to avoid disclosure of individual company data. |
| Release Date: 3/29/2024 |
| Next Release Date: 8/30/2024 |