|
Download Data (XLS File) |
|
||||||||
|
||||||||
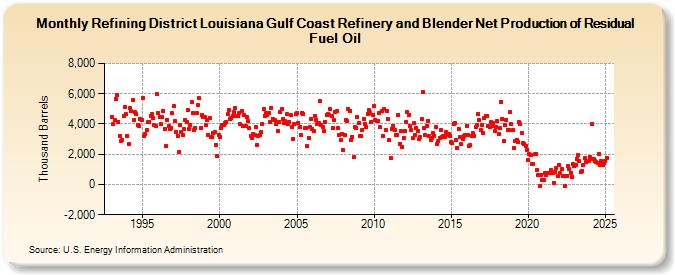
| Refining District Louisiana Gulf Coast Refinery and Blender Net Production of Residual Fuel Oil (Thousand Barrels) | ||||||||
| Year | Jan | Feb | Mar | Apr | May | Jun | Jul | Aug | Sep | Oct | Nov | Dec |
|---|---|---|---|---|---|---|---|---|---|---|---|---|
| 1993 | 4,470 | 3,970 | 4,248 | 5,663 | 5,936 | 4,153 | 3,203 | 2,880 | 2,909 | 4,524 | 5,153 | 4,637 |
| 1994 | 3,235 | 2,674 | 5,030 | 4,829 | 5,609 | 4,262 | 4,777 | 4,633 | 3,964 | 3,857 | 4,325 | 4,269 |
| 1995 | 5,742 | 3,197 | 3,356 | 3,585 | 4,099 | 4,133 | 4,549 | 4,683 | 4,370 | 3,920 | 3,851 | 5,965 |
| 1996 | 4,717 | 4,472 | 3,966 | 4,489 | 4,826 | 3,681 | 2,562 | 4,278 | 3,888 | 3,645 | 3,703 | 4,707 |
| 1997 | 5,204 | 4,179 | 3,493 | 3,227 | 2,153 | 3,948 | 3,485 | 3,267 | 3,658 | 4,246 | 4,120 | 4,900 |
| 1998 | 3,679 | 3,956 | 5,451 | 4,693 | 3,594 | 3,765 | 4,713 | 5,224 | 5,703 | 3,758 | 4,610 | 4,460 |
| 1999 | 4,430 | 3,930 | 4,247 | 3,257 | 4,397 | 3,154 | 3,127 | 3,391 | 3,459 | 2,599 | 1,858 | 3,303 |
| 2000 | 3,111 | 3,760 | 3,935 | 3,961 | 4,087 | 4,118 | 4,643 | 4,891 | 4,314 | 4,367 | 4,534 | 4,787 |
| 2001 | 5,049 | 4,549 | 4,503 | 4,731 | 3,991 | 4,842 | 3,853 | 4,572 | 3,855 | 4,441 | 4,182 | 3,712 |
| 2002 | 3,187 | 3,082 | 3,352 | 3,258 | 3,832 | 2,594 | 3,188 | 3,293 | 3,456 | 4,025 | 5,011 | 4,547 |
| 2003 | 4,701 | 4,606 | 4,747 | 4,132 | 5,086 | 4,346 | 4,275 | 4,237 | 3,975 | 3,528 | 4,163 | 4,806 |
| 2004 | 4,965 | 4,316 | 4,034 | 4,185 | 4,639 | 3,993 | 4,152 | 4,574 | 3,774 | 3,028 | 3,981 | 4,670 |
| 2005 | 4,748 | 4,089 | 3,782 | 3,294 | 4,751 | 4,666 | 3,728 | 3,733 | 2,520 | 3,073 | 3,789 | 4,344 |
| 2006 | 3,674 | 3,513 | 4,513 | 4,258 | 3,989 | 4,087 | 5,528 | 3,962 | 3,827 | 3,513 | 4,155 | 4,618 |
| 2007 | 4,637 | 4,609 | 4,988 | 4,549 | 3,720 | 4,235 | 4,779 | 4,873 | 3,724 | 3,256 | 2,934 | 3,351 |
| 2008 | 2,267 | 3,290 | 4,268 | 4,164 | 4,985 | 4,885 | 2,950 | 3,166 | 1,789 | 3,801 | 3,739 | 4,469 |
| 2009 | 4,039 | 3,192 | 3,216 | 3,624 | 4,329 | 4,003 | 3,789 | 4,691 | 4,903 | 4,724 | 4,153 | 4,596 |
| 2010 | 5,182 | 4,291 | 4,224 | 4,203 | 4,756 | 3,773 | 4,876 | 3,206 | 4,959 | 3,586 | 4,830 | 4,324 |
| 2011 | 2,936 | 1,751 | 3,690 | 3,840 | 3,595 | 3,257 | 3,266 | 4,617 | 2,661 | 3,537 | 2,471 | 3,099 |
| 2012 | 3,534 | 4,104 | 4,770 | 4,595 | 3,895 | 3,595 | 3,050 | 4,037 | 3,257 | 3,724 | 3,555 | 3,000 |
| 2013 | 3,118 | 4,310 | 6,128 | 3,711 | 3,267 | 3,855 | 4,227 | 3,177 | 2,958 | 3,095 | 3,405 | 3,206 |
| 2014 | 3,779 | 2,680 | 2,850 | 3,097 | 3,599 | 3,155 | 3,221 | 3,154 | 3,442 | 3,254 | 3,348 | 3,226 |
| 2015 | 2,827 | 2,755 | 4,026 | 4,069 | 2,973 | 2,434 | 3,682 | 3,106 | 2,651 | 3,028 | 3,223 | 3,253 |
| 2016 | 3,899 | 3,259 | 2,536 | 2,579 | 3,194 | 3,430 | 3,223 | 3,780 | 3,911 | 4,671 | 4,244 | 3,589 |
| 2017 | 3,954 | 3,372 | 4,381 | 4,518 | 4,524 | 3,893 | 3,786 | 4,134 | 3,858 | 4,064 | 3,514 | 3,806 |
| 2018 | 4,223 | 3,327 | 3,718 | 5,459 | 4,358 | 2,866 | 3,960 | 4,267 | 3,608 | 3,583 | 4,793 | 3,996 |
| 2019 | 3,595 | 2,398 | 2,879 | 2,972 | 2,817 | 4,129 | 3,976 | 3,402 | 2,754 | 2,669 | 2,545 | 2,311 |
| 2020 | 1,605 | 1,997 | 1,973 | 1,333 | 1,383 | 1,986 | 2,032 | 953 | 635 | -107 | 648 | 326 |
| 2021 | 289 | 747 | 638 | 768 | 732 | 755 | 955 | 764 | 127 | 841 | 1,075 | 568 |
| 2022 | 1,281 | 727 | 1,011 | 539 | 577 | -106 | 554 | 1,238 | 991 | 779 | 521 | 1,333 |
| 2023 | 1,200 | 1,268 | 1,700 | 1,931 | 1,540 | 834 | 893 | 1,268 | 1,732 | 1,506 | 1,572 | 1,552 |
| 2024 | 1,785 | |||||||||||
| - = No Data Reported; -- = Not Applicable; NA = Not Available; W = Withheld to avoid disclosure of individual company data. |
| Release Date: 3/29/2024 |
| Next Release Date: 4/30/2024 |