|
Download Data (XLS File) |
|
||||||||
|
||||||||
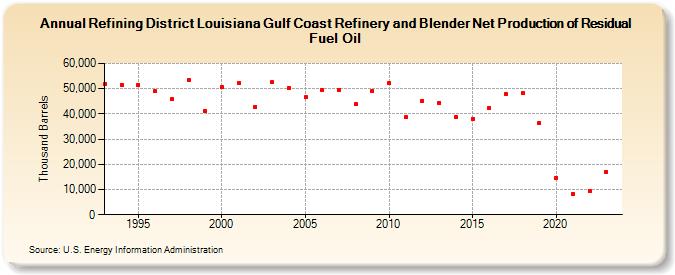
| Refining District Louisiana Gulf Coast Refinery and Blender Net Production of Residual Fuel Oil (Thousand Barrels) | ||||||||
| Decade | Year-0 | Year-1 | Year-2 | Year-3 | Year-4 | Year-5 | Year-6 | Year-7 | Year-8 | Year-9 |
|---|---|---|---|---|---|---|---|---|---|---|
| 1990's | 51,746 | 51,464 | 51,450 | 48,934 | 45,880 | 53,606 | 41,152 | |||
| 2000's | 50,508 | 52,280 | 42,825 | 52,602 | 50,311 | 46,517 | 49,637 | 49,655 | 43,773 | 49,259 |
| 2010's | 52,210 | 38,720 | 45,116 | 44,457 | 38,805 | 38,027 | 42,315 | 47,804 | 48,158 | 36,447 |
| 2020's | 14,764 | 8,259 | 9,445 | 16,996 |
| - = No Data Reported; -- = Not Applicable; NA = Not Available; W = Withheld to avoid disclosure of individual company data. |
| Release Date: 6/28/2024 |
| Next Release Date: 8/30/2024 |