|
Download Data (XLS File) |
|
||||||||
|
||||||||
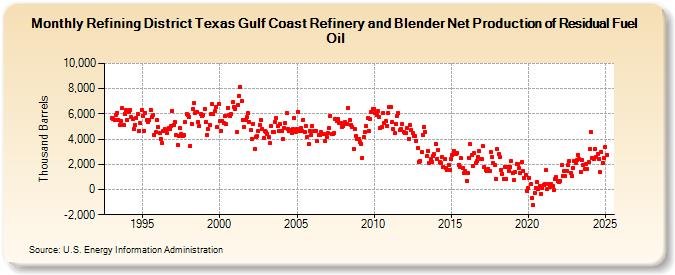
| Refining District Texas Gulf Coast Refinery and Blender Net Production of Residual Fuel Oil (Thousand Barrels) | ||||||||
| Year | Jan | Feb | Mar | Apr | May | Jun | Jul | Aug | Sep | Oct | Nov | Dec |
|---|---|---|---|---|---|---|---|---|---|---|---|---|
| 1993 | 5,667 | 5,604 | 5,500 | 5,910 | 6,096 | 5,550 | 5,094 | 5,426 | 6,448 | 5,152 | 6,009 | 6,299 |
| 1994 | 5,522 | 6,137 | 6,333 | 5,737 | 5,564 | 4,768 | 5,106 | 5,699 | 6,008 | 4,681 | 5,238 | 6,325 |
| 1995 | 5,858 | 4,675 | 6,093 | 5,528 | 5,372 | 5,510 | 6,348 | 5,749 | 5,925 | 4,310 | 4,542 | 5,528 |
| 1996 | 4,952 | 4,483 | 4,047 | 3,685 | 4,635 | 4,780 | 4,626 | 4,463 | 4,871 | 4,762 | 5,045 | 6,210 |
| 1997 | 5,157 | 5,384 | 4,293 | 3,545 | 4,235 | 4,884 | 4,388 | 4,212 | 4,307 | 5,325 | 5,967 | 5,901 |
| 1998 | 5,772 | 3,474 | 5,232 | 6,403 | 6,881 | 6,104 | 6,142 | 5,364 | 5,025 | 6,001 | 5,820 | 5,882 |
| 1999 | 6,388 | 5,342 | 4,337 | 4,800 | 5,120 | 5,965 | 6,749 | 5,969 | 6,203 | 6,548 | 4,923 | 6,770 |
| 2000 | 5,442 | 4,640 | 5,457 | 5,311 | 5,827 | 5,163 | 6,486 | 5,886 | 5,851 | 5,990 | 6,904 | 6,554 |
| 2001 | 6,396 | 4,526 | 6,728 | 7,443 | 8,152 | 7,052 | 5,487 | 4,944 | 5,540 | 5,749 | 6,039 | 5,363 |
| 2002 | 4,716 | 4,033 | 5,237 | 3,175 | 4,174 | 4,226 | 4,659 | 5,129 | 5,501 | 4,802 | 4,075 | 4,633 |
| 2003 | 4,564 | 4,413 | 4,161 | 3,668 | 5,043 | 4,567 | 4,541 | 5,374 | 5,660 | 5,005 | 4,670 | 5,190 |
| 2004 | 4,655 | 4,040 | 4,904 | 5,256 | 6,100 | 4,830 | 4,607 | 4,721 | 4,523 | 4,780 | 5,673 | 4,553 |
| 2005 | 4,831 | 6,162 | 4,668 | 4,871 | 4,637 | 5,537 | 4,588 | 5,058 | 4,197 | 3,602 | 4,672 | 4,308 |
| 2006 | 5,031 | 4,609 | 4,640 | 4,678 | 3,826 | 4,331 | 4,355 | 4,529 | 4,412 | 4,407 | 3,836 | 4,155 |
| 2007 | 4,479 | 4,871 | 5,841 | 4,422 | 4,437 | 4,466 | 5,622 | 5,450 | 5,605 | 5,285 | 5,251 | 4,998 |
| 2008 | 5,008 | 5,349 | 5,185 | 5,192 | 6,472 | 5,494 | 5,141 | 4,962 | 3,232 | 4,767 | 4,256 | 3,978 |
| 2009 | 4,004 | 3,762 | 3,641 | 2,539 | 4,167 | 4,537 | 5,020 | 5,636 | 4,643 | 5,593 | 6,169 | 6,412 |
| 2010 | 6,425 | 6,044 | 5,909 | 6,199 | 5,761 | 4,874 | 4,954 | 6,070 | 5,243 | 5,399 | 5,078 | 6,079 |
| 2011 | 6,508 | 6,534 | 5,326 | 4,788 | 4,464 | 5,192 | 5,843 | 6,043 | 4,699 | 4,808 | 5,236 | 4,543 |
| 2012 | 4,496 | 4,496 | 4,902 | 4,012 | 5,082 | 4,695 | 4,503 | 4,278 | 4,215 | 3,849 | 3,333 | 2,194 |
| 2013 | 2,273 | 2,964 | 4,343 | 4,979 | 4,556 | 2,689 | 3,042 | 2,121 | 2,396 | 2,209 | 2,635 | 2,790 |
| 2014 | 3,636 | 2,460 | 3,172 | 2,152 | 2,139 | 2,566 | 1,808 | 2,443 | 1,737 | 1,582 | 1,967 | 1,553 |
| 2015 | 2,459 | 2,706 | 3,045 | 2,886 | 2,816 | 2,936 | 1,980 | 1,773 | 2,472 | 1,681 | 1,271 | 1,462 |
| 2016 | 693 | 1,325 | 2,461 | 3,577 | 2,741 | 1,843 | 2,881 | 2,066 | 2,234 | 2,553 | 3,029 | 2,460 |
| 2017 | 2,395 | 3,420 | 1,789 | 1,543 | 1,468 | 1,661 | 1,499 | 2,993 | 2,563 | 2,074 | 1,943 | 873 |
| 2018 | 3,178 | 2,791 | 2,555 | 1,583 | 1,260 | 852 | 1,821 | 803 | 1,747 | 1,484 | 1,800 | 2,248 |
| 2019 | 1,285 | 734 | 1,416 | 2,023 | 1,989 | 1,686 | 1,338 | 2,167 | 1,458 | 947 | 1,178 | -132 |
| 2020 | 81 | 930 | 414 | -654 | -1,267 | -256 | 124 | 558 | 25 | 254 | -334 | 102 |
| 2021 | 374 | 458 | 1,526 | 2 | 414 | 216 | 447 | 257 | -40 | 844 | 1,001 | 650 |
| 2022 | 562 | 688 | 1,908 | 1,106 | 1,446 | 1,041 | 1,508 | 1,921 | 2,251 | 1,324 | 1,092 | 1,738 |
| 2023 | 2,297 | 2,123 | 2,343 | 2,776 | 2,440 | 1,426 | 2,327 | 1,973 | 1,609 | 1,998 | 1,636 | 2,166 |
| 2024 | 3,207 | |||||||||||
| - = No Data Reported; -- = Not Applicable; NA = Not Available; W = Withheld to avoid disclosure of individual company data. |
| Release Date: 3/29/2024 |
| Next Release Date: 4/30/2024 |