|
Download Data (XLS File) |
|
||||||||
|
||||||||
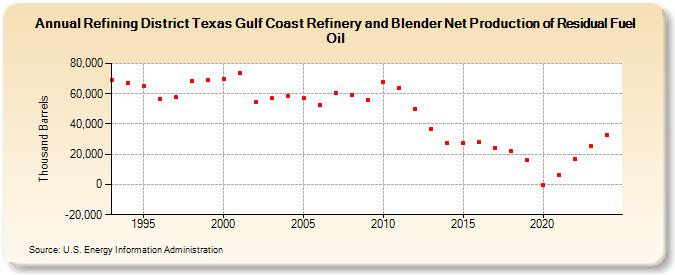
| Refining District Texas Gulf Coast Refinery and Blender Net Production of Residual Fuel Oil (Thousand Barrels) | ||||||||
| Decade | Year-0 | Year-1 | Year-2 | Year-3 | Year-4 | Year-5 | Year-6 | Year-7 | Year-8 | Year-9 |
|---|---|---|---|---|---|---|---|---|---|---|
| 1990's | 68,755 | 67,118 | 65,438 | 56,559 | 57,598 | 68,100 | 69,114 | |||
| 2000's | 69,511 | 73,419 | 54,360 | 56,856 | 58,642 | 57,131 | 52,809 | 60,727 | 59,036 | 56,123 |
| 2010's | 68,035 | 63,984 | 50,055 | 36,997 | 27,215 | 27,487 | 27,863 | 24,221 | 22,122 | 16,089 |
| 2020's | -23 | 6,149 | 16,585 | 25,114 |
| - = No Data Reported; -- = Not Applicable; NA = Not Available; W = Withheld to avoid disclosure of individual company data. |
| Release Date: 3/29/2024 |
| Next Release Date: 8/30/2024 |