|
Download Data (XLS File) |
|
||||||||
|
||||||||
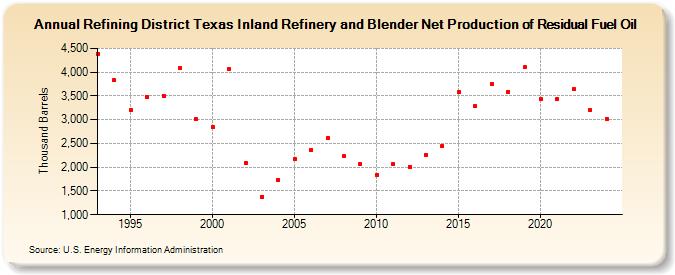
| Refining District Texas Inland Refinery and Blender Net Production of Residual Fuel Oil (Thousand Barrels) | ||||||||
| Decade | Year-0 | Year-1 | Year-2 | Year-3 | Year-4 | Year-5 | Year-6 | Year-7 | Year-8 | Year-9 |
|---|---|---|---|---|---|---|---|---|---|---|
| 1990's | 4,390 | 3,829 | 3,200 | 3,477 | 3,506 | 4,080 | 3,008 | |||
| 2000's | 2,841 | 4,061 | 2,090 | 1,380 | 1,732 | 2,172 | 2,368 | 2,613 | 2,230 | 2,063 |
| 2010's | 1,843 | 2,064 | 2,011 | 2,262 | 2,450 | 3,583 | 3,282 | 3,759 | 3,583 | 4,101 |
| 2020's | 3,427 | 3,439 | 3,643 | 3,202 |
| - = No Data Reported; -- = Not Applicable; NA = Not Available; W = Withheld to avoid disclosure of individual company data. |
| Release Date: 3/29/2024 |
| Next Release Date: 8/30/2024 |