|
Download Data (XLS File) |
|
||||||||
|
||||||||
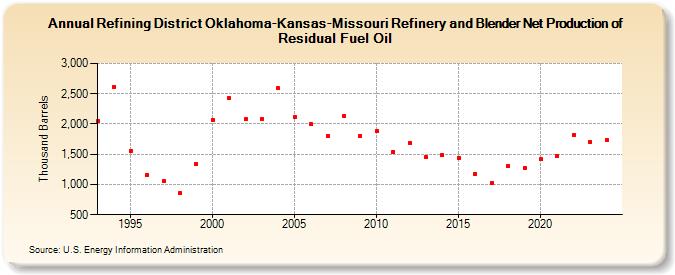
| Refining District Oklahoma-Kansas-Missouri Refinery and Blender Net Production of Residual Fuel Oil (Thousand Barrels) | ||||||||
| Decade | Year-0 | Year-1 | Year-2 | Year-3 | Year-4 | Year-5 | Year-6 | Year-7 | Year-8 | Year-9 |
|---|---|---|---|---|---|---|---|---|---|---|
| 1990's | 2,050 | 2,617 | 1,560 | 1,158 | 1,050 | 863 | 1,335 | |||
| 2000's | 2,071 | 2,422 | 2,078 | 2,086 | 2,589 | 2,120 | 1,995 | 1,808 | 2,131 | 1,803 |
| 2010's | 1,878 | 1,544 | 1,688 | 1,446 | 1,493 | 1,435 | 1,169 | 1,021 | 1,308 | 1,275 |
| 2020's | 1,413 | 1,467 | 1,819 | 1,709 |
| - = No Data Reported; -- = Not Applicable; NA = Not Available; W = Withheld to avoid disclosure of individual company data. |
| Release Date: 3/29/2024 |
| Next Release Date: 8/30/2024 |