|
Download Data (XLS File) |
|
||||||||
|
||||||||
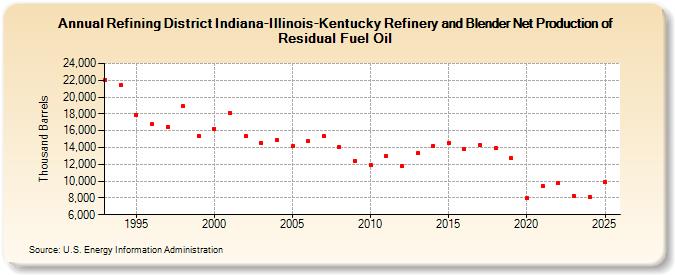
| Refining District Indiana-Illinois-Kentucky Refinery and Blender Net Production of Residual Fuel Oil (Thousand Barrels) | ||||||||
| Decade | Year-0 | Year-1 | Year-2 | Year-3 | Year-4 | Year-5 | Year-6 | Year-7 | Year-8 | Year-9 |
|---|---|---|---|---|---|---|---|---|---|---|
| 1990's | 22,051 | 21,457 | 17,891 | 16,751 | 16,442 | 18,884 | 15,402 | |||
| 2000's | 16,253 | 18,145 | 15,314 | 14,549 | 14,918 | 14,125 | 14,732 | 15,365 | 14,083 | 12,439 |
| 2010's | 11,897 | 12,936 | 11,794 | 13,340 | 14,180 | 14,580 | 13,801 | 14,308 | 13,889 | 12,731 |
| 2020's | 7,955 | 9,414 | 9,745 | 8,204 |
| - = No Data Reported; -- = Not Applicable; NA = Not Available; W = Withheld to avoid disclosure of individual company data. |
| Release Date: 3/29/2024 |
| Next Release Date: 8/30/2024 |