|
Download Data (XLS File) |
|
||||||||
|
||||||||
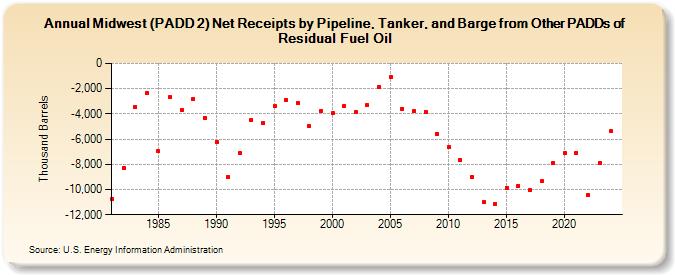
| Midwest (PADD 2) Net Receipts by Pipeline, Tanker, and Barge from Other PADDs of Residual Fuel Oil (Thousand Barrels) | ||||||||
| Decade | Year-0 | Year-1 | Year-2 | Year-3 | Year-4 | Year-5 | Year-6 | Year-7 | Year-8 | Year-9 |
|---|---|---|---|---|---|---|---|---|---|---|
| 1980's | -10,756 | -8,276 | -3,443 | -2,309 | -6,968 | -2,660 | -3,673 | -2,810 | -4,293 | |
| 1990's | -6,221 | -8,983 | -7,091 | -4,512 | -4,691 | -3,384 | -2,882 | -3,131 | -4,994 | -3,742 |
| 2000's | -3,957 | -3,356 | -3,876 | -3,295 | -1,865 | -1,085 | -3,581 | -3,779 | -3,811 | -5,563 |
| 2010's | -6,649 | -7,655 | -8,997 | -11,013 | -11,148 | -9,851 | -9,693 | -10,067 | -9,347 | -7,893 |
| 2020's | -7,109 | -7,073 | -10,428 | -7,847 |
| - = No Data Reported; -- = Not Applicable; NA = Not Available; W = Withheld to avoid disclosure of individual company data. |
| Release Date: 3/29/2024 |
| Next Release Date: 8/30/2024 |