|
Download Data (XLS File) |
|
||||||||
|
||||||||
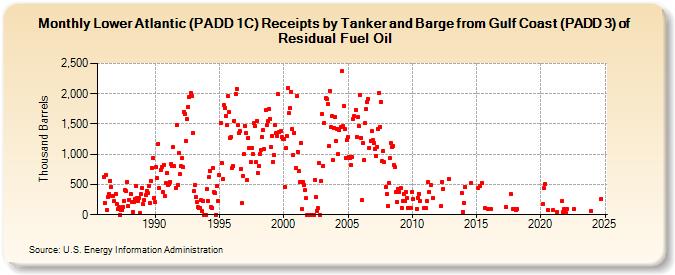
| Lower Atlantic (PADD 1C) Receipts by Tanker and Barge from Gulf Coast (PADD 3) of Residual Fuel Oil (Thousand Barrels) | ||||||||
| Year | Jan | Feb | Mar | Apr | May | Jun | Jul | Aug | Sep | Oct | Nov | Dec |
|---|---|---|---|---|---|---|---|---|---|---|---|---|
| 1986 | 627 | 201 | 664 | 75 | 299 | 345 | 560 | 462 | 311 | 312 | 220 | 348 |
| 1987 | 173 | 88 | 124 | 0 | 75 | 72 | 128 | 227 | 402 | 385 | 542 | 137 |
| 1988 | 244 | 343 | 212 | 53 | 214 | 253 | 482 | 276 | 232 | 281 | 21 | 336 |
| 1989 | 446 | 170 | 237 | 320 | 400 | 352 | 477 | 189 | 556 | 779 | 934 | 281 |
| 1990 | 211 | 786 | 602 | 1,175 | 439 | 740 | 783 | 379 | 830 | 310 | 522 | 696 |
| 1991 | 498 | 501 | 545 | 841 | 807 | 1,119 | 801 | 447 | 1,475 | 492 | 1,020 | 675 |
| 1992 | 803 | 935 | 784 | 1,702 | 1,669 | 1,219 | 1,577 | 1,785 | 1,943 | 2,020 | 1,961 | 1,353 |
| 1993 | 386 | 489 | 288 | 211 | 120 | 117 | 119 | 239 | 57 | 223 | 0 | 0 |
| 1994 | 420 | 233 | 623 | 724 | 125 | 115 | 773 | 371 | 360 | 0 | 479 | 229 |
| 1995 | 655 | 1,522 | 858 | 584 | 1,809 | 1,763 | 1,636 | 1,478 | 1,955 | 1,698 | 1,271 | 1,282 |
| 1996 | 765 | 799 | 1,557 | 1,996 | 2,084 | 1,475 | 1,354 | 1,383 | 759 | 193 | 648 | 996 |
| 1997 | 1,468 | 1,345 | 570 | 1,274 | 1,096 | 865 | 1,095 | 1,003 | 1,512 | 1,471 | 864 | 1,554 |
| 1998 | 686 | 798 | 1,009 | 1,076 | 1,288 | 1,393 | 1,079 | 1,724 | 1,479 | 1,549 | 1,742 | 1,584 |
| 1999 | 1,119 | 1,306 | 878 | 993 | 1,479 | 1,358 | 1,307 | 1,995 | 1,363 | 1,381 | 1,284 | 1,258 |
| 2000 | 1,245 | 462 | 1,099 | 1,293 | 2,090 | 1,681 | 1,759 | 2,035 | 1,420 | 989 | 1,353 | 769 |
| 2001 | 1,968 | 1,043 | 718 | 538 | 1,183 | 97 | 546 | 488 | 408 | 270 | 0 | 0 |
| 2002 | 0 | 0 | 0 | 0 | 0 | 580 | 286 | 69 | 105 | 850 | 0 | 556 |
| 2003 | 1,666 | 813 | 1,521 | 1,924 | 1,918 | 1,830 | 1,132 | 2,051 | 1,442 | 1,631 | 906 | 1,439 |
| 2004 | 1,620 | 1,225 | 1,423 | 1,001 | 1,396 | 1,452 | 2,371 | 1,459 | 1,800 | 1,421 | 935 | 1,238 |
| 2005 | 1,292 | 957 | 942 | 814 | 954 | 1,587 | 1,627 | 1,729 | 1,285 | 1,612 | 1,468 | 1,984 |
| 2006 | 1,276 | 239 | 1,179 | 908 | 1,520 | 1,740 | 1,858 | 1,911 | 1,109 | 1,223 | 1,382 | 1,238 |
| 2007 | 1,180 | 1,083 | 974 | 1,120 | 1,422 | 2,015 | 1,450 | 1,869 | 883 | 1,051 | 867 | 455 |
| 2008 | 340 | 149 | 523 | 935 | 1,182 | 1,119 | 1,137 | 816 | 781 | 375 | 210 | 422 |
| 2009 | 378 | 444 | 117 | 226 | 344 | 222 | 381 | 278 | 116 | 118 | 115 | |
| 2010 | 382 | 252 | 101 | 282 | 349 | 230 | 114 | |||||
| 2011 | 110 | 225 | 539 | 383 | 490 | 280 | ||||||
| 2012 | 144 | 546 | 429 | 596 | ||||||||
| 2013 | 360 | 53 | ||||||||||
| 2014 | 197 | 457 | 523 | |||||||||
| 2015 | 436 | 476 | 530 | 118 | 100 | |||||||
| 2016 | 100 | |||||||||||
| 2017 | 129 | 340 | 100 | 99 | ||||||||
| 2018 | 70 | 94 | ||||||||||
| 2020 | 173 | 435 | 510 | 72 | 70 | |||||||
| 2021 | 49 | 228 | 45 | 87 | 27 | |||||||
| 2022 | 92 | 93 | ||||||||||
| 2023 | 57 | |||||||||||
| - = No Data Reported; -- = Not Applicable; NA = Not Available; W = Withheld to avoid disclosure of individual company data. |
| Release Date: 3/29/2024 |
| Next Release Date: 4/30/2024 |