|
Download Data (XLS File) |
|
||||||||
|
||||||||
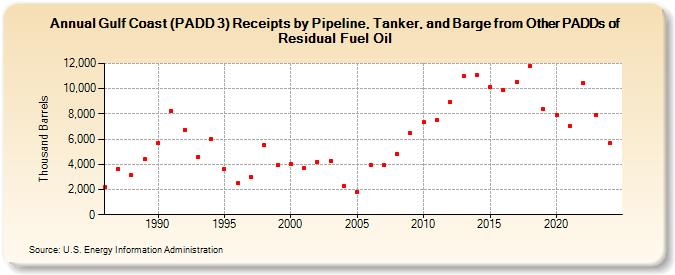
| Gulf Coast (PADD 3) Receipts by Pipeline, Tanker, and Barge from Other PADDs of Residual Fuel Oil (Thousand Barrels) | ||||||||
| Decade | Year-0 | Year-1 | Year-2 | Year-3 | Year-4 | Year-5 | Year-6 | Year-7 | Year-8 | Year-9 |
|---|---|---|---|---|---|---|---|---|---|---|
| 1980's | 2,163 | 3,656 | 3,112 | 4,417 | ||||||
| 1990's | 5,706 | 8,222 | 6,746 | 4,565 | 6,041 | 3,664 | 2,481 | 3,012 | 5,517 | 3,936 |
| 2000's | 4,057 | 3,690 | 4,196 | 4,291 | 2,310 | 1,812 | 3,984 | 3,944 | 4,848 | 6,474 |
| 2010's | 7,350 | 7,530 | 8,953 | 10,984 | 11,124 | 10,139 | 9,879 | 10,493 | 11,819 | 8,361 |
| 2020's | 7,939 | 7,073 | 10,464 | 7,847 |
| - = No Data Reported; -- = Not Applicable; NA = Not Available; W = Withheld to avoid disclosure of individual company data. |
| Release Date: 3/29/2024 |
| Next Release Date: 8/30/2024 |