|
Download Data (XLS File) |
|
||||||||
|
||||||||
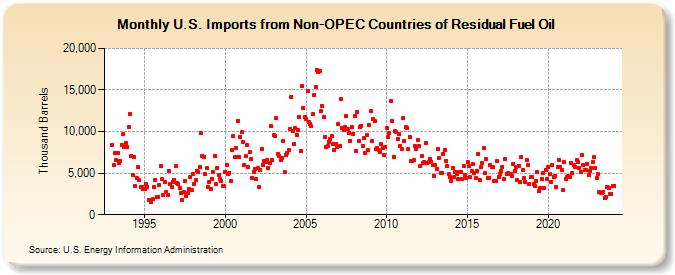
| U.S. Imports from Non-OPEC Countries of Residual Fuel Oil (Thousand Barrels) | ||||||||
| Year | Jan | Feb | Mar | Apr | May | Jun | Jul | Aug | Sep | Oct | Nov | Dec |
|---|---|---|---|---|---|---|---|---|---|---|---|---|
| 1993 | 8,440 | 6,005 | 7,481 | 6,596 | 7,434 | 6,229 | 6,516 | 8,438 | 9,730 | 8,137 | 8,637 | 8,151 |
| 1994 | 10,549 | 12,098 | 7,101 | 4,809 | 6,912 | 3,480 | 4,426 | 5,721 | 4,135 | 3,386 | 3,370 | 3,121 |
| 1995 | 3,051 | 3,666 | 3,360 | 1,818 | 1,782 | 1,560 | 1,863 | 3,378 | 4,224 | 2,170 | 2,168 | 3,514 |
| 1996 | 5,860 | 4,240 | 2,421 | 3,963 | 2,767 | 2,366 | 5,307 | 3,736 | 3,288 | 3,891 | 4,174 | 5,855 |
| 1997 | 3,789 | 3,644 | 3,190 | 2,600 | 1,825 | 2,704 | 4,067 | 2,309 | 2,589 | 3,036 | 4,510 | 2,943 |
| 1998 | 4,911 | 3,695 | 4,137 | 5,296 | 5,127 | 5,688 | 9,774 | 7,072 | 6,940 | 4,873 | 5,616 | 3,275 |
| 1999 | 3,882 | 3,119 | 4,351 | 5,125 | 7,102 | 3,662 | 5,637 | 4,803 | 4,236 | 4,071 | 3,398 | 3,508 |
| 2000 | 5,155 | 6,030 | 4,919 | 5,052 | 4,058 | 7,813 | 9,523 | 6,911 | 7,997 | 11,270 | 6,961 | 9,383 |
| 2001 | 9,899 | 8,779 | 5,949 | 7,014 | 8,323 | 5,767 | 7,507 | 6,727 | 4,358 | 5,123 | 5,553 | 4,259 |
| 2002 | 5,597 | 3,373 | 5,384 | 7,882 | 5,996 | 6,475 | 6,321 | 6,549 | 5,601 | 6,218 | 10,608 | 6,575 |
| 2003 | 9,527 | 9,505 | 11,590 | 7,301 | 7,101 | 6,574 | 6,788 | 8,906 | 5,087 | 7,216 | 7,464 | 7,770 |
| 2004 | 10,346 | 14,185 | 10,105 | 8,525 | 10,389 | 9,639 | 10,188 | 11,729 | 7,656 | 15,483 | 12,772 | 11,768 |
| 2005 | 11,560 | 14,930 | 11,168 | 10,963 | 10,623 | 12,079 | 14,376 | 15,389 | 17,428 | 17,106 | 17,327 | 12,441 |
| 2006 | 13,057 | 11,713 | 9,405 | 8,149 | 8,238 | 8,727 | 9,128 | 9,407 | 8,450 | 7,726 | 8,462 | 8,165 |
| 2007 | 10,887 | 8,226 | 13,927 | 10,417 | 10,190 | 10,491 | 11,864 | 10,295 | 9,776 | 8,894 | 10,507 | 9,761 |
| 2008 | 11,863 | 7,666 | 12,304 | 8,915 | 10,552 | 10,692 | 8,317 | 9,169 | 7,449 | 9,596 | 7,725 | 10,818 |
| 2009 | 12,483 | 8,921 | 11,479 | 11,266 | 7,900 | 8,005 | 7,797 | 7,556 | 8,468 | 8,054 | 7,186 | 8,180 |
| 2010 | 10,379 | 9,357 | 9,768 | 13,729 | 11,322 | 6,947 | 10,033 | 9,904 | 9,156 | 9,727 | 8,320 | 7,943 |
| 2011 | 11,598 | 8,922 | 10,553 | 10,462 | 7,890 | 9,348 | 6,485 | 6,434 | 6,563 | 8,227 | 7,872 | 8,998 |
| 2012 | 8,227 | 5,812 | 7,102 | 6,255 | 6,365 | 8,624 | 6,201 | 6,305 | 6,726 | 6,392 | 5,999 | 4,709 |
| 2013 | 5,937 | 5,547 | 7,852 | 6,822 | 5,063 | 4,970 | 7,318 | 7,729 | 6,491 | 5,857 | 4,925 | 4,525 |
| 2014 | 4,078 | 5,643 | 4,508 | 5,113 | 4,842 | 4,275 | 5,123 | 5,157 | 4,244 | 5,843 | 4,729 | 4,449 |
| 2015 | 6,367 | 5,916 | 4,529 | 5,274 | 6,046 | 5,043 | 4,471 | 5,248 | 7,281 | 4,217 | 5,701 | 6,207 |
| 2016 | 8,001 | 5,030 | 6,657 | 4,435 | 4,463 | 6,005 | 5,762 | 5,708 | 4,084 | 4,092 | 6,445 | 4,548 |
| 2017 | 4,903 | 5,217 | 5,794 | 4,249 | 6,696 | 4,912 | 4,987 | 4,932 | 4,917 | 4,674 | 6,155 | 5,199 |
| 2018 | 5,734 | 4,160 | 5,914 | 3,979 | 6,942 | 5,341 | 4,422 | 3,925 | 6,545 | 5,950 | 3,737 | 4,483 |
| 2019 | 4,563 | 3,646 | 3,446 | 4,072 | 5,077 | 2,909 | 3,163 | 4,344 | 4,966 | 3,219 | 5,425 | 4,342 |
| 2020 | 5,746 | 4,915 | 3,958 | 6,009 | 4,572 | 4,641 | 3,381 | 5,790 | 6,556 | 5,783 | 5,370 | 2,924 |
| 2021 | 6,352 | 4,350 | 4,482 | 4,678 | 4,520 | 6,165 | 5,024 | 5,985 | 5,695 | 6,564 | 6,385 | 5,655 |
| 2022 | 5,131 | 7,219 | 5,924 | 5,354 | 5,352 | 6,115 | 4,813 | 5,267 | 5,621 | 6,323 | 6,888 | 5,605 |
| 2023 | 4,433 | 4,881 | 2,719 | 2,665 | 2,658 | 2,736 | 2,006 | 2,161 | 3,365 | 3,210 | 2,513 | 2,543 |
| 2024 | 3,430 | |||||||||||
| - = No Data Reported; -- = Not Applicable; NA = Not Available; W = Withheld to avoid disclosure of individual company data. |
| Release Date: 3/29/2024 |
| Next Release Date: 4/30/2024 |