|
Download Data (XLS File) |
|
||||||||
|
||||||||
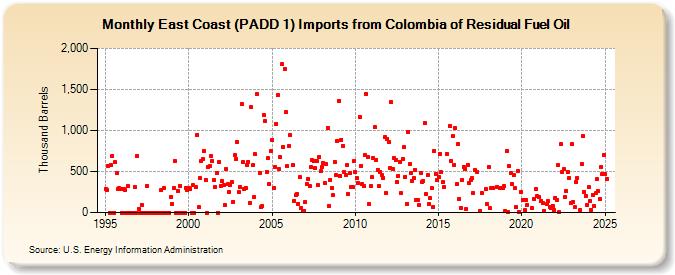
| East Coast (PADD 1) Imports from Colombia of Residual Fuel Oil (Thousand Barrels) | ||||||||
| Year | Jan | Feb | Mar | Apr | May | Jun | Jul | Aug | Sep | Oct | Nov | Dec |
|---|---|---|---|---|---|---|---|---|---|---|---|---|
| 1995 | 288 | 280 | 572 | 0 | 575 | 691 | 0 | 610 | 477 | 289 | 295 | 291 |
| 1996 | 0 | 293 | 277 | 0 | 323 | 0 | 0 | 0 | 0 | 309 | 0 | 688 |
| 1997 | 44 | 0 | 91 | 0 | 0 | 0 | 321 | 0 | 0 | 0 | 0 | 0 |
| 1998 | 0 | 0 | 0 | 0 | 270 | 0 | 300 | 0 | 0 | 0 | 0 | 194 |
| 1999 | 100 | 296 | 630 | 0 | 268 | 0 | 324 | 0 | 0 | 0 | 304 | 271 |
| 2000 | 296 | 290 | 0 | 335 | 0 | 308 | 949 | 63 | 417 | 633 | 649 | 747 |
| 2001 | 402 | 0 | 556 | 562 | 688 | 626 | 397 | 314 | 488 | 0 | 622 | 326 |
| 2002 | 383 | 335 | 94 | 529 | 343 | 249 | 330 | 369 | 132 | 698 | 655 | 860 |
| 2003 | 250 | 309 | 1,325 | 618 | 288 | 301 | 582 | 616 | 120 | 1,284 | 575 | 189 |
| 2004 | 709 | 1,442 | 478 | 64 | 80 | 1,192 | 1,116 | 500 | 659 | 347 | 752 | |
| 2005 | 884 | 297 | 558 | 1,083 | 1,428 | 526 | 675 | 1,804 | 800 | 1,752 | 1,223 | 563 |
| 2006 | 813 | 947 | 578 | 143 | 213 | 231 | 110 | 428 | 53 | 20 | 24 | |
| 2007 | 127 | 350 | 405 | 322 | 549 | 637 | 624 | 548 | 624 | 334 | 678 | 502 |
| 2008 | 559 | 602 | 361 | 593 | 1,032 | 81 | 397 | 304 | 210 | 616 | 453 | 870 |
| 2009 | 1,363 | 449 | 889 | 815 | 490 | 452 | 577 | 229 | 476 | 308 | 312 | 628 |
| 2010 | 493 | 415 | 364 | 1,166 | 571 | 347 | 321 | 702 | 1,449 | 677 | 100 | 322 |
| 2011 | 435 | 661 | 1,038 | 644 | 522 | 320 | 497 | 457 | 427 | 915 | 241 | 898 |
| 2012 | 859 | 548 | 1,346 | 529 | 662 | 643 | 368 | 450 | 620 | 233 | 656 | 798 |
| 2013 | 432 | 109 | 986 | 589 | 485 | 387 | 417 | 522 | 154 | 149 | 96 | 485 |
| 2014 | 373 | 382 | 1,087 | 226 | 456 | 103 | 173 | 294 | 68 | 751 | 475 | 398 |
| 2015 | 431 | 713 | 490 | 369 | 314 | 715 | 1,059 | 629 | 927 | 582 | ||
| 2016 | 1,033 | 346 | 834 | 171 | 60 | 399 | 557 | 530 | 39 | 583 | 359 | 401 |
| 2017 | 416 | 236 | 515 | 495 | 18 | 240 | 281 | 100 | ||||
| 2018 | 556 | 52 | 300 | 298 | 311 | 297 | 302 | 300 | 318 | |||
| 2019 | 19 | 749 | 9 | 563 | 481 | 350 | 456 | 296 | 63 | 501 | 9 | 251 |
| 2020 | 150 | 27 | 147 | 95 | 60 | 167 | 284 | 197 | ||||
| 2021 | 187 | 139 | 121 | 22 | 100 | 140 | 62 | 50 | 84 | 32 | ||
| 2022 | 181 | 151 | 576 | 7 | 830 | 489 | 531 | 185 | 262 | 494 | 418 | 113 |
| 2023 | 831 | 128 | 64 | 370 | 419 | 30 | 596 | 935 | 251 | 205 | 97 | |
| 2024 | 307 | |||||||||||
| - = No Data Reported; -- = Not Applicable; NA = Not Available; W = Withheld to avoid disclosure of individual company data. |
| Release Date: 3/29/2024 |
| Next Release Date: 4/30/2024 |