|
Download Data (XLS File) |
|
||||||||
|
||||||||
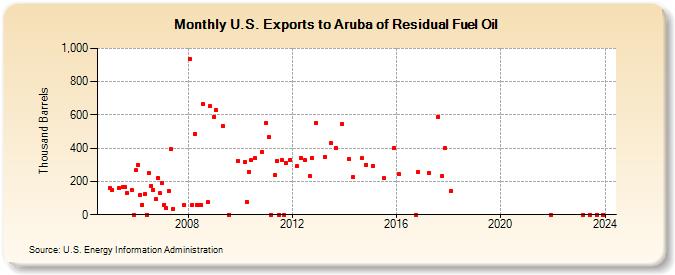
| U.S. Exports to Aruba of Residual Fuel Oil (Thousand Barrels) | ||||||||
| Year | Jan | Feb | Mar | Apr | May | Jun | Jul | Aug | Sep | Oct | Nov | Dec |
|---|---|---|---|---|---|---|---|---|---|---|---|---|
| 2005 | 160 | 150 | 160 | 167 | 165 | 130 | 150 | 1 | ||||
| 2006 | 266 | 299 | 120 | 61 | 123 | 0 | 249 | 175 | 150 | 93 | 220 | 129 |
| 2007 | 191 | 60 | 38 | 144 | 394 | 35 | 60 | |||||
| 2008 | 936 | 60 | 484 | 60 | 60 | 61 | 663 | 74 | 652 | |||
| 2009 | 590 | 627 | 532 | 0 | 325 | |||||||
| 2010 | 318 | 77 | 259 | 326 | 338 | 380 | ||||||
| 2011 | 552 | 465 | 0 | 237 | 320 | 0 | 329 | 0 | 311 | 331 | ||
| 2012 | 291 | 341 | 327 | 232 | 341 | 553 | ||||||
| 2013 | 350 | 429 | 400 | 546 | ||||||||
| 2014 | 337 | 226 | 338 | 301 | ||||||||
| 2015 | 294 | 220 | 403 | |||||||||
| 2016 | 243 | 0 | 259 | |||||||||
| 2017 | 253 | 589 | 234 | 400 | ||||||||
| 2018 | 144 | |||||||||||
| 2021 | 0 | |||||||||||
| 2023 | 0 | 0 | 0 | 0 | ||||||||
| - = No Data Reported; -- = Not Applicable; NA = Not Available; W = Withheld to avoid disclosure of individual company data. |
| Release Date: 3/29/2024 |
| Next Release Date: 4/30/2024 |