|
Download Data (XLS File) |
|
||||||||
|
||||||||
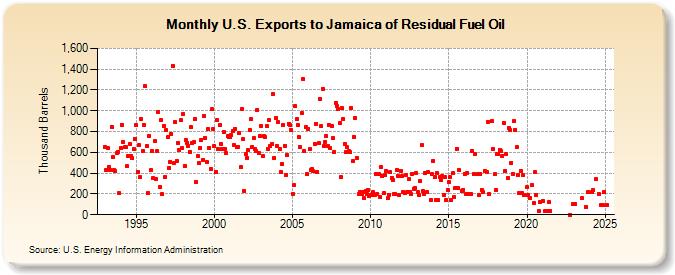
| U.S. Exports to Jamaica of Residual Fuel Oil (Thousand Barrels) | ||||||||
| Year | Jan | Feb | Mar | Apr | May | Jun | Jul | Aug | Sep | Oct | Nov | Dec |
|---|---|---|---|---|---|---|---|---|---|---|---|---|
| 1993 | 653 | 428 | 646 | 461 | 434 | 848 | 551 | 431 | 418 | 591 | 607 | 206 |
| 1994 | 642 | 866 | 695 | 648 | 647 | 466 | 561 | 682 | 564 | 541 | 629 | 731 |
| 1995 | 860 | 415 | 669 | 359 | 920 | 612 | 867 | 1,234 | 659 | 208 | 758 | 426 |
| 1996 | 617 | 351 | 707 | 348 | 613 | 989 | 264 | 909 | 199 | 855 | 362 | 813 |
| 1997 | 744 | 450 | 510 | 779 | 1,434 | 498 | 890 | 520 | 690 | 620 | 908 | 641 |
| 1998 | 970 | 471 | 721 | 694 | 664 | 608 | 842 | 687 | 696 | 920 | 315 | 562 |
| 1999 | 493 | 645 | 722 | 530 | 947 | 737 | 505 | 822 | 643 | 440 | 1,014 | 826 |
| 2000 | 659 | 415 | 908 | 628 | 862 | 684 | 630 | 796 | 630 | 589 | 754 | 748 |
| 2001 | 746 | 764 | 803 | 668 | 829 | 647 | 654 | 789 | 457 | 1,017 | 727 | 228 |
| 2002 | 582 | 549 | 622 | 819 | 918 | 650 | 735 | 631 | 615 | 1,011 | 590 | 757 |
| 2003 | 849 | 561 | 755 | 749 | 852 | 630 | 915 | 660 | 677 | 1,159 | 547 | 931 |
| 2004 | 662 | 888 | 629 | 410 | 488 | 862 | 665 | 386 | 575 | 876 | 865 | 814 |
| 2005 | 201 | 282 | 1,041 | 918 | 863 | 743 | 648 | 974 | 1,304 | 611 | 840 | 387 |
| 2006 | 825 | 631 | 431 | 441 | 418 | 685 | 877 | 415 | 686 | 1,111 | 850 | 1,211 |
| 2007 | 661 | 704 | 759 | 660 | 866 | 638 | 855 | 735 | 608 | 1,076 | 1,042 | 1,016 |
| 2008 | 886 | 359 | 1,022 | 920 | 684 | 605 | 647 | 610 | 599 | 1,023 | 513 | 752 |
| 2009 | 935 | 548 | 201 | 219 | 200 | 221 | 160 | 227 | 200 | 233 | 180 | |
| 2010 | 187 | 185 | 216 | 190 | 387 | 197 | 393 | 170 | 455 | 369 | 208 | 380 |
| 2011 | 416 | 158 | 190 | 408 | 356 | 333 | 195 | 197 | 430 | 374 | 190 | 424 |
| 2012 | 370 | 216 | 207 | 385 | 220 | 342 | 219 | 197 | 396 | 248 | 260 | 402 |
| 2013 | 216 | 191 | 322 | 672 | 225 | 200 | 400 | 215 | 407 | 140 | 389 | |
| 2014 | 521 | 360 | 142 | 405 | 140 | 360 | 330 | 373 | 190 | 360 | 140 | 236 |
| 2015 | 310 | 361 | 140 | 399 | 168 | 256 | 636 | 254 | 427 | 224 | 241 | |
| 2016 | 394 | 200 | 403 | 201 | 200 | 611 | 389 | 586 | 391 | 190 | ||
| 2017 | 392 | 241 | 222 | 417 | 408 | 895 | 195 | 899 | 630 | 387 | ||
| 2018 | 236 | 580 | 588 | 623 | 617 | 568 | 886 | 424 | 586 | 356 | 835 | 814 |
| 2019 | 500 | 393 | 901 | 818 | 649 | 382 | 205 | 422 | 205 | 381 | 191 | |
| 2020 | 264 | 190 | 157 | 286 | 115 | 407 | 194 | 35 | 120 | |||
| 2021 | 132 | 33 | 32 | 120 | 32 | |||||||
| 2022 | 0 | 100 | ||||||||||
| 2023 | 101 | 158 | 78 | 220 | ||||||||
| - = No Data Reported; -- = Not Applicable; NA = Not Available; W = Withheld to avoid disclosure of individual company data. |
| Release Date: 3/29/2024 |
| Next Release Date: 4/30/2024 |