|
Download Data (XLS File) |
|
||||||||
|
||||||||
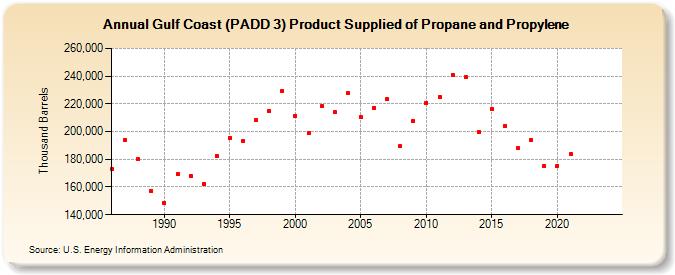
| Gulf Coast (PADD 3) Product Supplied of Propane and Propylene (Thousand Barrels) | ||||||||
| Decade | Year-0 | Year-1 | Year-2 | Year-3 | Year-4 | Year-5 | Year-6 | Year-7 | Year-8 | Year-9 |
|---|---|---|---|---|---|---|---|---|---|---|
| 1980's | 172,829 | 193,986 | 179,907 | 157,235 | ||||||
| 1990's | 148,654 | 169,213 | 168,246 | 162,159 | 182,556 | 195,601 | 193,239 | 208,107 | 215,006 | 229,605 |
| 2000's | 211,415 | 198,833 | 218,318 | 214,102 | 227,590 | 210,436 | 217,352 | 223,474 | 189,429 | 207,742 |
| 2010's | 220,893 | 225,014 | 240,952 | 239,358 | 199,857 | 216,521 | 204,109 | 187,787 | 194,227 | 174,990 |
| 2020's | 175,422 | 183,508 | -- | -- |
| - = No Data Reported; -- = Not Applicable; NA = Not Available; W = Withheld to avoid disclosure of individual company data. |
| Release Date: 6/28/2024 |
| Next Release Date: 8/30/2024 |