|
Download Data (XLS File) |
|
||||||||
|
||||||||
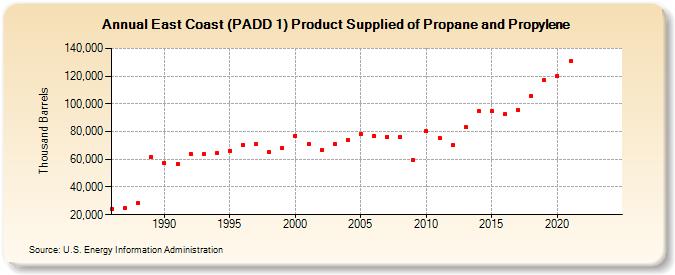
| East Coast (PADD 1) Product Supplied of Propane and Propylene (Thousand Barrels) | ||||||||
| Decade | Year-0 | Year-1 | Year-2 | Year-3 | Year-4 | Year-5 | Year-6 | Year-7 | Year-8 | Year-9 |
|---|---|---|---|---|---|---|---|---|---|---|
| 1980's | 24,196 | 24,869 | 28,512 | 61,845 | ||||||
| 1990's | 57,277 | 56,604 | 63,856 | 63,660 | 64,402 | 66,329 | 70,566 | 70,724 | 65,066 | 68,440 |
| 2000's | 76,980 | 70,860 | 67,048 | 71,166 | 73,551 | 78,055 | 76,889 | 76,155 | 76,258 | 59,603 |
| 2010's | 80,081 | 75,378 | 69,982 | 83,000 | 94,534 | 94,690 | 92,400 | 95,762 | 105,843 | 117,243 |
| 2020's | 120,175 | 130,592 | -- | -- |
| - = No Data Reported; -- = Not Applicable; NA = Not Available; W = Withheld to avoid disclosure of individual company data. |
| Release Date: 6/28/2024 |
| Next Release Date: 8/30/2024 |