|
Download Data (XLS File) |
|
||||||||
|
||||||||
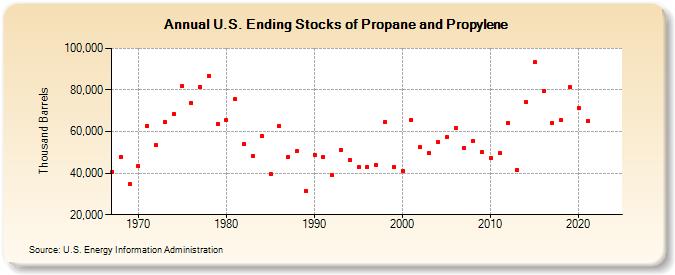
| U.S. Ending Stocks of Propane and Propylene (Thousand Barrels) | ||||||||
| Decade | Year-0 | Year-1 | Year-2 | Year-3 | Year-4 | Year-5 | Year-6 | Year-7 | Year-8 | Year-9 |
|---|---|---|---|---|---|---|---|---|---|---|
| 1960's | 40,577 | 47,548 | 34,677 | |||||||
| 1970's | 43,322 | 62,861 | 53,561 | 64,647 | 68,606 | 81,843 | 73,804 | 81,444 | 86,885 | 63,793 |
| 1980's | 65,356 | 75,558 | 54,130 | 48,191 | 57,803 | 39,475 | 62,852 | 47,792 | 50,427 | 31,528 |
| 1990's | 48,915 | 47,645 | 38,884 | 51,205 | 46,463 | 42,911 | 43,008 | 44,045 | 64,633 | 43,026 |
| 2000's | 41,192 | 65,771 | 52,552 | 49,500 | 54,999 | 57,231 | 61,599 | 52,007 | 55,408 | 50,140 |
| 2010's | 47,227 | 49,749 | 64,338 | 41,552 | 74,281 | 93,268 | 79,392 | 64,253 | 65,528 | 81,329 |
| 2020's | 71,343 | 65,236 | -- | -- |
| - = No Data Reported; -- = Not Applicable; NA = Not Available; W = Withheld to avoid disclosure of individual company data. |
| Release Date: 3/29/2024 |
| Next Release Date: 8/30/2024 |