|
Download Data (XLS File) |
|
||||||||
|
||||||||
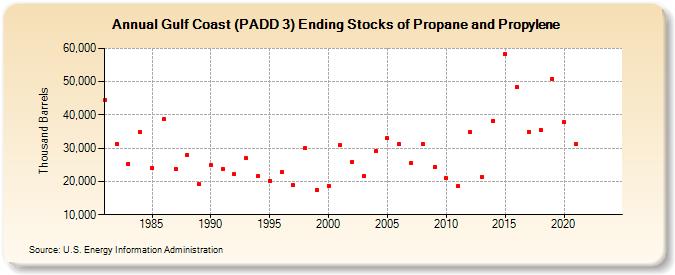
| Gulf Coast (PADD 3) Ending Stocks of Propane and Propylene (Thousand Barrels) | ||||||||
| Decade | Year-0 | Year-1 | Year-2 | Year-3 | Year-4 | Year-5 | Year-6 | Year-7 | Year-8 | Year-9 |
|---|---|---|---|---|---|---|---|---|---|---|
| 1980's | 44,460 | 31,310 | 25,368 | 34,839 | 24,081 | 38,649 | 23,862 | 28,026 | 19,093 | |
| 1990's | 24,813 | 23,890 | 22,124 | 26,950 | 21,624 | 20,189 | 22,822 | 18,798 | 29,972 | 17,484 |
| 2000's | 18,775 | 31,001 | 25,963 | 21,636 | 29,016 | 33,020 | 31,198 | 25,679 | 31,310 | 24,385 |
| 2010's | 20,922 | 18,702 | 34,856 | 21,487 | 38,283 | 58,199 | 48,322 | 35,000 | 35,565 | 50,924 |
| 2020's | 37,876 | 31,157 | -- | -- |
| - = No Data Reported; -- = Not Applicable; NA = Not Available; W = Withheld to avoid disclosure of individual company data. |
| Release Date: 3/29/2024 |
| Next Release Date: 8/30/2024 |