|
Download Data (XLS File) |
|
||||||||
|
||||||||
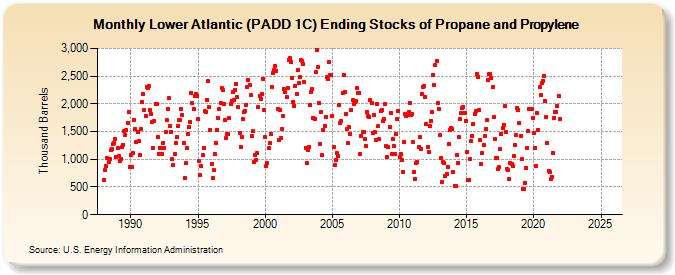
| Lower Atlantic (PADD 1C) Ending Stocks of Propane and Propylene (Thousand Barrels) | ||||||||
| Year | Jan | Feb | Mar | Apr | May | Jun | Jul | Aug | Sep | Oct | Nov | Dec |
|---|---|---|---|---|---|---|---|---|---|---|---|---|
| 1988 | 627 | 799 | 871 | 1,031 | 959 | 996 | 1,159 | 1,184 | 1,267 | 1,295 | 1,370 | 1,036 |
| 1989 | 1,200 | 1,058 | 963 | 1,011 | 1,224 | 1,254 | 1,514 | 1,444 | 1,529 | 1,662 | 1,858 | 862 |
| 1990 | 1,075 | 862 | 1,107 | 1,709 | 1,539 | 1,306 | 1,487 | 1,321 | 1,080 | 1,544 | 2,034 | 2,172 |
| 1991 | 1,895 | 1,786 | 2,305 | 2,280 | 2,320 | 1,894 | 1,811 | 1,665 | 1,202 | 1,686 | 2,000 | 1,997 |
| 1992 | 1,400 | 1,100 | 1,200 | 1,200 | 1,100 | 1,300 | 1,200 | 1,500 | 1,700 | 1,900 | 2,100 | 1,600 |
| 1993 | 1,500 | 1,000 | 900 | 1,100 | 1,300 | 1,400 | 1,600 | 1,700 | 1,700 | 1,900 | 1,800 | 1,300 |
| 1994 | 658 | 928 | 1,196 | 1,452 | 1,587 | 1,677 | 2,203 | 2,014 | 1,901 | 2,137 | 2,179 | 2,138 |
| 1995 | 1,718 | 964 | 710 | 870 | 1,074 | 1,209 | 1,863 | 1,859 | 2,074 | 2,404 | 1,946 | 1,532 |
| 1996 | 921 | 660 | 798 | 1,095 | 1,292 | 1,536 | 1,742 | 1,911 | 2,017 | 2,283 | 2,241 | 2,002 |
| 1997 | 1,714 | 1,376 | 1,450 | 1,447 | 1,742 | 1,998 | 2,052 | 2,210 | 2,078 | 2,252 | 2,364 | 2,120 |
| 1998 | 1,942 | 1,474 | 1,230 | 1,407 | 1,725 | 1,848 | 1,874 | 1,980 | 2,300 | 2,429 | 2,343 | 2,151 |
| 1999 | 1,424 | 1,502 | 956 | 1,071 | 983 | 1,113 | 1,944 | 2,142 | 2,093 | 2,169 | 2,449 | 1,896 |
| 2000 | 1,402 | 874 | 932 | 1,195 | 1,285 | 1,457 | 2,298 | 2,565 | 2,610 | 2,680 | 2,599 | 1,912 |
| 2001 | 1,353 | 1,892 | 1,388 | 1,542 | 1,772 | 2,261 | 2,206 | 2,127 | 2,278 | 2,791 | 2,825 | 2,757 |
| 2002 | 2,471 | 2,042 | 1,967 | 2,328 | 2,176 | 2,602 | 2,379 | 2,483 | 2,787 | 2,766 | 2,720 | 2,387 |
| 2003 | 1,206 | 930 | 1,163 | 1,225 | 1,976 | 2,205 | 2,264 | 1,751 | 1,729 | 2,567 | 2,971 | 2,673 |
| 2004 | 2,007 | 1,271 | 1,855 | 1,074 | 1,535 | 1,608 | 1,761 | 2,475 | 2,443 | 2,755 | 2,528 | 2,520 |
| 2005 | 1,781 | 1,215 | 898 | 988 | 1,110 | 1,066 | 1,986 | 1,648 | 1,692 | 2,188 | 2,516 | 2,205 |
| 2006 | 1,822 | 1,555 | 1,291 | 1,575 | 1,462 | 1,895 | 2,063 | 1,997 | 2,042 | 2,054 | 2,278 | 2,191 |
| 2007 | 2,196 | 1,099 | 1,422 | 1,491 | 1,495 | 1,360 | 1,241 | 1,845 | 1,781 | 1,767 | 2,062 | 2,018 |
| 2008 | 1,475 | 1,801 | 1,483 | 1,354 | 1,999 | 1,600 | 1,369 | 1,864 | 1,895 | 1,691 | 1,721 | 1,989 |
| 2009 | 1,243 | 1,049 | 1,214 | 1,587 | 1,843 | 1,096 | 1,363 | 1,238 | 1,088 | 1,448 | 1,729 | 1,877 |
| 2010 | 1,035 | 1,094 | 989 | 774 | 1,317 | 1,815 | 1,789 | 1,802 | 1,848 | 2,024 | 1,794 | 1,819 |
| 2011 | 1,304 | 762 | 645 | 941 | 955 | 1,219 | 1,396 | 1,191 | 2,176 | 2,306 | 2,325 | 2,120 |
| 2012 | 1,635 | 1,225 | 1,133 | 1,598 | 1,687 | 1,847 | 2,526 | 2,334 | 2,692 | 2,769 | 2,010 | 1,911 |
| 2013 | 1,438 | 1,024 | 588 | 955 | 930 | 699 | 733 | 862 | 1,277 | 1,528 | 1,564 | 1,543 |
| 2014 | 779 | 519 | 523 | 1,085 | 940 | 1,397 | 1,727 | 1,832 | 1,916 | 1,946 | 1,840 | 1,697 |
| 2015 | 1,130 | 624 | 628 | 1,000 | 1,324 | 1,420 | 1,641 | 1,822 | 1,866 | 2,545 | 2,490 | 1,885 |
| 2016 | 1,343 | 907 | 1,113 | 1,257 | 1,421 | 1,544 | 1,707 | 2,429 | 2,531 | 2,534 | 2,474 | 2,308 |
| 2017 | 1,756 | 1,369 | 1,015 | 1,027 | 823 | 855 | 1,181 | 1,461 | 1,560 | 1,623 | 1,953 | 1,497 |
| 2018 | 824 | 799 | 641 | 932 | 916 | 879 | 1,063 | 1,264 | 1,434 | 1,931 | 1,893 | 1,656 |
| 2019 | 1,412 | 998 | 462 | 461 | 573 | 846 | 1,212 | 1,518 | 1,911 | 1,912 | 1,905 | 1,742 |
| 2020 | 1,476 | 1,199 | 875 | 1,833 | 1,528 | 2,308 | 2,156 | 2,376 | 2,417 | 2,507 | 2,047 | 1,763 |
| 2021 | 1,302 | 795 | 768 | 640 | 684 | 1,109 | 1,742 | 1,858 | 1,850 | 1,962 | 2,144 | 1,718 |
| 2022 | -- | -- | -- | -- | -- | -- | -- | -- | -- | -- | -- | -- |
| 2023 | -- | -- | -- | -- | -- | -- | -- | -- | -- | -- | -- | -- |
| 2024 | -- | |||||||||||
| - = No Data Reported; -- = Not Applicable; NA = Not Available; W = Withheld to avoid disclosure of individual company data. |
| Release Date: 3/29/2024 |
| Next Release Date: 4/30/2024 |