|
Download Data (XLS File) |
|
||||||||
|
||||||||
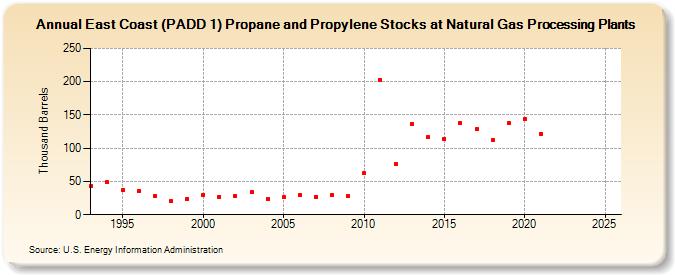
| East Coast (PADD 1) Propane and Propylene Stocks at Natural Gas Processing Plants (Thousand Barrels) | ||||||||
| Decade | Year-0 | Year-1 | Year-2 | Year-3 | Year-4 | Year-5 | Year-6 | Year-7 | Year-8 | Year-9 |
|---|---|---|---|---|---|---|---|---|---|---|
| 1990's | 43 | 49 | 37 | 36 | 28 | 20 | 24 | |||
| 2000's | 30 | 27 | 28 | 34 | 24 | 26 | 30 | 27 | 30 | 28 |
| 2010's | 62 | 203 | 76 | 137 | 117 | 114 | 138 | 129 | 112 | 138 |
| 2020's | 144 | 122 | -- | -- |
| - = No Data Reported; -- = Not Applicable; NA = Not Available; W = Withheld to avoid disclosure of individual company data. |
| Release Date: 3/29/2024 |
| Next Release Date: 8/30/2024 |