|
Download Data (XLS File) |
|
||||||||
|
||||||||
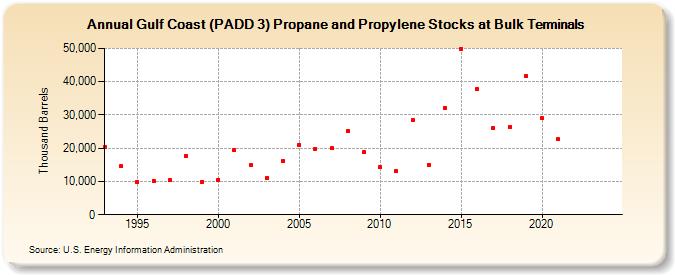
| Gulf Coast (PADD 3) Propane and Propylene Stocks at Bulk Terminals (Thousand Barrels) | ||||||||
| Decade | Year-0 | Year-1 | Year-2 | Year-3 | Year-4 | Year-5 | Year-6 | Year-7 | Year-8 | Year-9 |
|---|---|---|---|---|---|---|---|---|---|---|
| 1990's | 20,352 | 14,534 | 9,857 | 10,270 | 10,369 | 17,654 | 9,933 | |||
| 2000's | 10,573 | 19,362 | 14,862 | 11,009 | 16,255 | 21,059 | 19,863 | 19,927 | 25,234 | 18,765 |
| 2010's | 14,281 | 13,119 | 28,434 | 15,058 | 32,115 | 49,925 | 37,665 | 26,021 | 26,457 | 41,649 |
| 2020's | 29,029 | 22,656 | -- | -- |
| - = No Data Reported; -- = Not Applicable; NA = Not Available; W = Withheld to avoid disclosure of individual company data. |
| Release Date: 3/29/2024 |
| Next Release Date: 8/30/2024 |