|
Download Data (XLS File) |
|
||||||||
|
||||||||
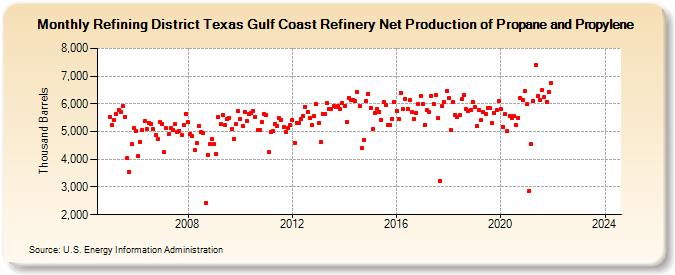
| Refining District Texas Gulf Coast Refinery Net Production of Propane and Propylene (Thousand Barrels) | ||||||||
| Year | Jan | Feb | Mar | Apr | May | Jun | Jul | Aug | Sep | Oct | Nov | Dec |
|---|---|---|---|---|---|---|---|---|---|---|---|---|
| 2005 | 5,538 | 5,224 | 5,434 | 5,639 | 5,769 | 5,708 | 5,910 | 5,533 | 4,036 | 3,550 | 4,536 | 5,117 |
| 2006 | 5,002 | 4,127 | 4,619 | 5,061 | 5,378 | 5,091 | 5,295 | 5,266 | 5,086 | 4,873 | 4,717 | 5,333 |
| 2007 | 5,275 | 4,251 | 5,134 | 4,896 | 5,114 | 5,052 | 5,266 | 4,988 | 5,015 | 4,863 | 5,244 | 5,651 |
| 2008 | 5,333 | 4,917 | 4,832 | 4,324 | 4,584 | 5,218 | 4,992 | 4,937 | 2,437 | 4,165 | 4,550 | 4,723 |
| 2009 | 4,542 | 4,201 | 5,509 | 5,263 | 5,615 | 5,227 | 5,455 | 5,505 | 5,082 | 4,742 | 5,264 | 5,738 |
| 2010 | 5,459 | 5,202 | 5,718 | 5,384 | 5,644 | 5,668 | 5,740 | 5,535 | 5,039 | 5,069 | 5,337 | 5,649 |
| 2011 | 5,596 | 4,247 | 4,980 | 5,028 | 5,289 | 5,190 | 5,506 | 5,402 | 5,148 | 4,999 | 5,125 | 5,252 |
| 2012 | 5,408 | 4,602 | 5,320 | 5,295 | 5,457 | 5,551 | 5,875 | 5,707 | 5,495 | 5,243 | 5,556 | 5,984 |
| 2013 | 5,293 | 4,620 | 5,649 | 5,616 | 6,014 | 5,829 | 5,819 | 5,938 | 5,871 | 5,904 | 5,803 | 6,018 |
| 2014 | 5,937 | 5,348 | 6,228 | 6,153 | 6,148 | 6,089 | 6,442 | 5,939 | 4,393 | 4,709 | 6,111 | 6,366 |
| 2015 | 5,855 | 5,089 | 5,654 | 5,816 | 5,720 | 5,411 | 6,056 | 5,944 | 5,227 | 5,228 | 5,466 | 6,063 |
| 2016 | 5,757 | 5,444 | 6,407 | 5,796 | 6,187 | 5,808 | 6,122 | 5,713 | 5,446 | 5,666 | 5,985 | 6,289 |
| 2017 | 5,979 | 5,247 | 5,783 | 5,713 | 6,276 | 6,001 | 6,311 | 5,480 | 3,201 | 5,923 | 6,066 | 6,478 |
| 2018 | 6,215 | 5,041 | 6,071 | 5,605 | 5,518 | 5,584 | 6,165 | 6,314 | 5,797 | 5,745 | 5,795 | 6,080 |
| 2019 | 5,869 | 5,201 | 5,789 | 5,401 | 5,703 | 5,640 | 5,857 | 5,832 | 5,312 | 5,687 | 5,764 | 6,110 |
| 2020 | 5,820 | 5,181 | 5,619 | 5,015 | 5,548 | 5,501 | 5,563 | 5,226 | 5,500 | 6,211 | 6,126 | 6,452 |
| 2021 | 5,976 | 2,843 | 4,539 | 6,099 | 7,396 | 6,280 | 6,134 | 6,486 | 6,232 | 6,068 | 6,437 | 6,753 |
| 2022 | -- | -- | -- | -- | -- | -- | -- | -- | -- | -- | -- | -- |
| 2023 | -- | -- | -- | -- | -- | -- | -- | -- | -- | -- | -- | -- |
| 2024 | -- | |||||||||||
| - = No Data Reported; -- = Not Applicable; NA = Not Available; W = Withheld to avoid disclosure of individual company data. |
| Release Date: 3/29/2024 |
| Next Release Date: 4/30/2024 |