|
Download Data (XLS File) |
|
||||||||
|
||||||||
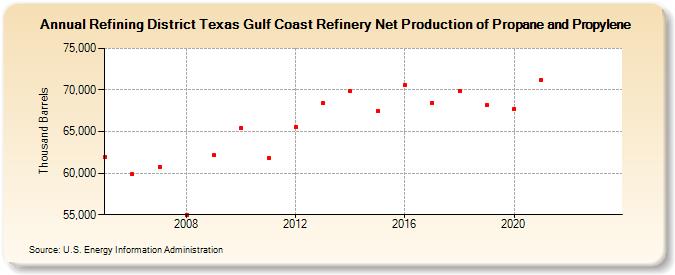
| Refining District Texas Gulf Coast Refinery Net Production of Propane and Propylene (Thousand Barrels) | ||||||||
| Decade | Year-0 | Year-1 | Year-2 | Year-3 | Year-4 | Year-5 | Year-6 | Year-7 | Year-8 | Year-9 |
|---|---|---|---|---|---|---|---|---|---|---|
| 2000's | 61,994 | 59,848 | 60,749 | 55,012 | 62,143 | |||||
| 2010's | 65,444 | 61,762 | 65,493 | 68,374 | 69,863 | 67,529 | 70,620 | 68,458 | 69,930 | 68,165 |
| 2020's | 67,762 | 71,243 | -- | -- |
| - = No Data Reported; -- = Not Applicable; NA = Not Available; W = Withheld to avoid disclosure of individual company data. |
| Release Date: 3/29/2024 |
| Next Release Date: 8/30/2024 |