|
Download Data (XLS File) |
|
||||||||
|
||||||||
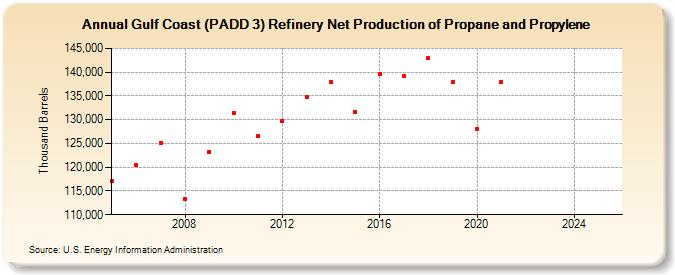
| Gulf Coast (PADD 3) Refinery Net Production of Propane and Propylene (Thousand Barrels) | ||||||||
| Decade | Year-0 | Year-1 | Year-2 | Year-3 | Year-4 | Year-5 | Year-6 | Year-7 | Year-8 | Year-9 |
|---|---|---|---|---|---|---|---|---|---|---|
| 2000's | 117,100 | 120,442 | 125,195 | 113,374 | 123,261 | |||||
| 2010's | 131,462 | 126,540 | 129,707 | 134,759 | 137,887 | 131,618 | 139,550 | 139,222 | 142,899 | 137,979 |
| 2020's | 128,045 | 137,991 | -- | -- |
| - = No Data Reported; -- = Not Applicable; NA = Not Available; W = Withheld to avoid disclosure of individual company data. |
| Release Date: 6/28/2024 |
| Next Release Date: 8/30/2024 |