|
Download Data (XLS File) |
|
||||||||
|
||||||||
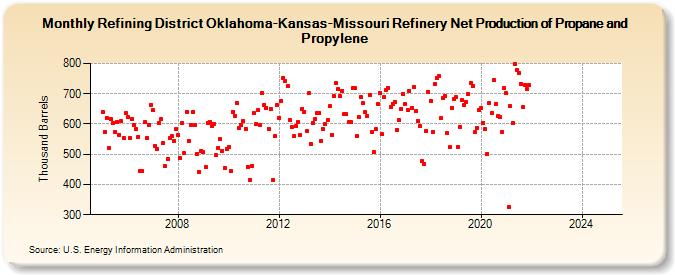
| Refining District Oklahoma-Kansas-Missouri Refinery Net Production of Propane and Propylene (Thousand Barrels) | ||||||||
| Year | Jan | Feb | Mar | Apr | May | Jun | Jul | Aug | Sep | Oct | Nov | Dec |
|---|---|---|---|---|---|---|---|---|---|---|---|---|
| 2005 | 638 | 573 | 621 | 519 | 616 | 604 | 573 | 605 | 565 | 610 | 555 | 635 |
| 2006 | 623 | 554 | 618 | 595 | 584 | 557 | 445 | 444 | 605 | 555 | 598 | 664 |
| 2007 | 646 | 527 | 517 | 604 | 615 | 536 | 460 | 484 | 553 | 560 | 544 | 582 |
| 2008 | 562 | 487 | 603 | 503 | 641 | 545 | 598 | 641 | 597 | 502 | 441 | 510 |
| 2009 | 506 | 458 | 604 | 607 | 592 | 601 | 496 | 522 | 551 | 510 | 455 | 516 |
| 2010 | 523 | 443 | 641 | 627 | 669 | 588 | 596 | 609 | 585 | 459 | 415 | 462 |
| 2011 | 636 | 599 | 647 | 596 | 704 | 663 | 653 | 583 | 651 | 414 | 559 | 663 |
| 2012 | 621 | 677 | 753 | 742 | 726 | 613 | 589 | 559 | 593 | 607 | 562 | 650 |
| 2013 | 640 | 576 | 701 | 534 | 603 | 615 | 636 | 637 | 544 | 582 | 599 | 614 |
| 2014 | 658 | 565 | 691 | 734 | 714 | 691 | 710 | 633 | 632 | 605 | 607 | 718 |
| 2015 | 718 | 559 | 622 | 689 | 669 | 638 | 627 | 697 | 572 | 507 | 582 | 666 |
| 2016 | 704 | 566 | 689 | 712 | 720 | 656 | 667 | 673 | 581 | 612 | 651 | 700 |
| 2017 | 667 | 646 | 710 | 654 | 722 | 642 | 610 | 592 | 477 | 467 | 578 | 706 |
| 2018 | 677 | 575 | 732 | 753 | 757 | 619 | 687 | 691 | 570 | 523 | 654 | 681 |
| 2019 | 688 | 524 | 590 | 678 | 664 | 672 | 700 | 736 | 726 | 574 | 588 | 645 |
| 2020 | 652 | 604 | 583 | 501 | 670 | 637 | 745 | 666 | 625 | 622 | 574 | 718 |
| 2021 | 702 | 326 | 659 | 603 | 798 | 780 | 770 | 733 | 656 | 730 | 715 | 728 |
| 2022 | -- | -- | -- | -- | -- | -- | -- | -- | -- | -- | -- | -- |
| 2023 | -- | -- | -- | -- | -- | -- | -- | -- | -- | -- | -- | -- |
| 2024 | -- | |||||||||||
| - = No Data Reported; -- = Not Applicable; NA = Not Available; W = Withheld to avoid disclosure of individual company data. |
| Release Date: 3/29/2024 |
| Next Release Date: 4/30/2024 |