|
Download Data (XLS File) |
|
||||||||
|
||||||||
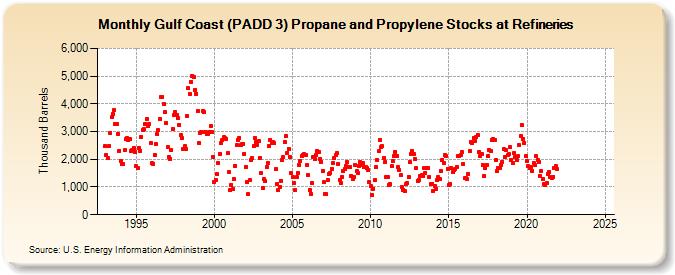
| Gulf Coast (PADD 3) Propane and Propylene Stocks at Refineries (Thousand Barrels) | ||||||||
| Year | Jan | Feb | Mar | Apr | May | Jun | Jul | Aug | Sep | Oct | Nov | Dec |
|---|---|---|---|---|---|---|---|---|---|---|---|---|
| 1993 | 2,465 | 2,161 | 2,055 | 2,468 | 2,947 | 3,511 | 3,638 | 3,762 | 3,266 | 3,279 | 2,912 | 2,314 |
| 1994 | 1,932 | 1,814 | 1,812 | 2,322 | 2,714 | 2,756 | 2,691 | 2,714 | 2,307 | 2,348 | 2,405 | 2,272 |
| 1995 | 1,751 | 1,681 | 2,402 | 2,308 | 2,815 | 3,063 | 3,090 | 3,274 | 3,468 | 3,183 | 3,280 | 2,582 |
| 1996 | 1,851 | 1,844 | 2,158 | 2,550 | 2,908 | 3,039 | 3,450 | 4,260 | 4,242 | 4,003 | 3,688 | 3,305 |
| 1997 | 2,426 | 2,076 | 2,025 | 2,320 | 3,085 | 3,609 | 3,709 | 3,603 | 3,484 | 3,250 | 2,859 | 2,768 |
| 1998 | 2,361 | 2,468 | 2,387 | 3,574 | 4,554 | 4,361 | 4,799 | 5,006 | 4,959 | 4,514 | 4,366 | 3,750 |
| 1999 | 2,582 | 2,958 | 2,995 | 3,739 | 3,695 | 2,991 | 2,906 | 2,919 | 2,993 | 3,212 | 2,972 | 2,096 |
| 2000 | 1,197 | 1,243 | 1,455 | 1,872 | 2,195 | 2,586 | 2,680 | 2,791 | 2,763 | 2,749 | 2,234 | 1,530 |
| 2001 | 907 | 1,074 | 913 | 1,285 | 1,772 | 2,498 | 2,713 | 2,779 | 2,504 | 2,533 | 2,566 | 2,196 |
| 2002 | 1,726 | 1,170 | 739 | 1,245 | 1,968 | 2,041 | 2,472 | 2,774 | 2,613 | 2,525 | 2,650 | 2,039 |
| 2003 | 1,492 | 978 | 1,279 | 1,204 | 1,723 | 1,861 | 2,463 | 2,704 | 2,597 | 2,612 | 2,585 | 1,652 |
| 2004 | 1,105 | 886 | 993 | 1,224 | 1,982 | 2,071 | 2,608 | 2,835 | 2,239 | 2,375 | 2,095 | 1,500 |
| 2005 | 1,345 | 1,153 | 900 | 1,350 | 1,505 | 1,796 | 1,933 | 2,122 | 2,172 | 2,179 | 2,150 | 1,791 |
| 2006 | 1,416 | 895 | 755 | 1,129 | 2,067 | 2,001 | 2,146 | 2,305 | 2,274 | 2,025 | 1,908 | 1,594 |
| 2007 | 1,165 | 750 | 744 | 1,253 | 1,463 | 1,522 | 1,660 | 1,868 | 2,056 | 2,141 | 2,220 | 1,843 |
| 2008 | 1,248 | 1,145 | 1,373 | 1,589 | 1,657 | 1,761 | 1,891 | 1,720 | 1,726 | 1,414 | 1,300 | 1,347 |
| 2009 | 1,797 | 1,569 | 1,521 | 1,771 | 1,895 | 1,810 | 1,862 | 1,706 | 1,738 | 1,684 | 1,627 | 1,181 |
| 2010 | 1,023 | 722 | 937 | 1,257 | 1,708 | 1,972 | 2,282 | 2,704 | 2,451 | 2,462 | 2,043 | 1,895 |
| 2011 | 1,367 | 1,369 | 1,067 | 1,090 | 1,746 | 1,920 | 2,133 | 2,274 | 2,107 | 1,706 | 1,604 | 1,419 |
| 2012 | 995 | 906 | 841 | 1,104 | 1,139 | 1,365 | 1,885 | 2,200 | 2,299 | 2,187 | 2,002 | 1,692 |
| 2013 | 1,227 | 1,248 | 1,408 | 1,416 | 1,385 | 1,677 | 1,513 | 1,671 | 1,682 | 1,363 | 1,107 | 1,125 |
| 2014 | 851 | 1,042 | 920 | 1,250 | 1,353 | 1,286 | 1,565 | 1,983 | 1,860 | 2,146 | 2,109 | 1,651 |
| 2015 | 1,076 | 1,116 | 1,676 | 1,527 | 1,604 | 1,657 | 1,724 | 2,106 | 2,121 | 2,144 | 2,253 | 1,825 |
| 2016 | 1,313 | 1,324 | 1,284 | 1,479 | 2,281 | 2,640 | 2,575 | 2,785 | 2,670 | 2,811 | 2,867 | 2,256 |
| 2017 | 2,108 | 2,178 | 1,810 | 1,405 | 1,670 | 1,801 | 2,118 | 2,343 | 2,303 | 2,693 | 2,727 | 2,684 |
| 2018 | 1,959 | 1,576 | 1,689 | 1,689 | 1,792 | 1,915 | 2,373 | 2,077 | 2,342 | 2,148 | 2,176 | 2,426 |
| 2019 | 1,991 | 1,864 | 2,209 | 2,091 | 1,956 | 2,116 | 2,508 | 2,831 | 3,234 | 2,748 | 2,584 | 2,116 |
| 2020 | 1,954 | 1,755 | 1,685 | 1,713 | 1,582 | 1,866 | 1,793 | 2,108 | 1,989 | 1,898 | 1,396 | 1,570 |
| 2021 | 1,282 | 1,097 | 1,079 | 1,136 | 1,467 | 1,540 | 1,343 | 1,340 | 1,368 | 1,675 | 1,756 | 1,634 |
| 2022 | -- | -- | -- | -- | -- | -- | -- | -- | -- | -- | -- | -- |
| 2023 | -- | -- | -- | -- | -- | -- | -- | -- | -- | -- | -- | -- |
| 2024 | -- | |||||||||||
| - = No Data Reported; -- = Not Applicable; NA = Not Available; W = Withheld to avoid disclosure of individual company data. |
| Release Date: 3/29/2024 |
| Next Release Date: 4/30/2024 |