|
Download Data (XLS File) |
|
||||||||
|
||||||||
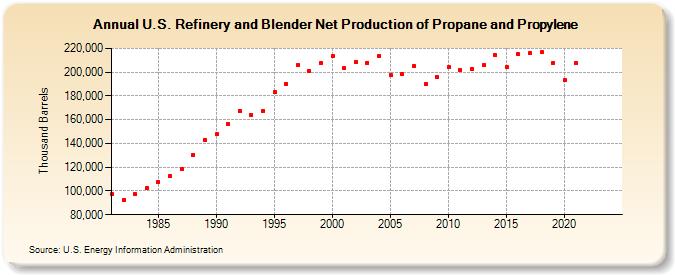
| U.S. Refinery and Blender Net Production of Propane and Propylene (Thousand Barrels) | ||||||||
| Decade | Year-0 | Year-1 | Year-2 | Year-3 | Year-4 | Year-5 | Year-6 | Year-7 | Year-8 | Year-9 |
|---|---|---|---|---|---|---|---|---|---|---|
| 1980's | 97,333 | 92,747 | 97,251 | 102,423 | 107,695 | 112,714 | 118,580 | 130,655 | 142,961 | |
| 1990's | 147,626 | 155,958 | 167,452 | 164,324 | 167,583 | 183,434 | 190,184 | 206,094 | 200,815 | 207,579 |
| 2000's | 213,405 | 203,121 | 208,909 | 207,958 | 213,750 | 197,256 | 198,190 | 205,179 | 190,020 | 196,011 |
| 2010's | 204,223 | 201,492 | 202,309 | 206,038 | 214,378 | 204,069 | 214,941 | 215,926 | 216,879 | 208,088 |
| 2020's | 193,070 | 207,450 | -- | -- |
| - = No Data Reported; -- = Not Applicable; NA = Not Available; W = Withheld to avoid disclosure of individual company data. |
| Release Date: 3/29/2024 |
| Next Release Date: 8/30/2024 |