|
Download Data (XLS File) |
|
||||||||
|
||||||||
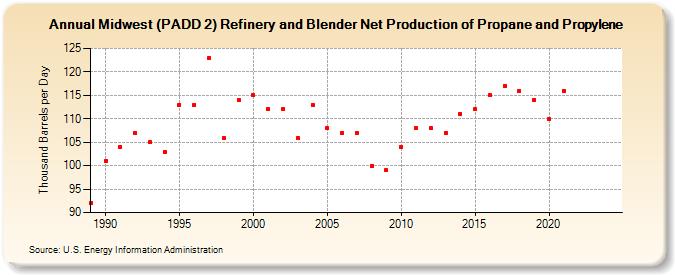
| Midwest (PADD 2) Refinery and Blender Net Production of Propane and Propylene (Thousand Barrels per Day) | ||||||||
| Decade | Year-0 | Year-1 | Year-2 | Year-3 | Year-4 | Year-5 | Year-6 | Year-7 | Year-8 | Year-9 |
|---|---|---|---|---|---|---|---|---|---|---|
| 1980's | 92 | |||||||||
| 1990's | 101 | 104 | 107 | 105 | 103 | 113 | 113 | 123 | 106 | 114 |
| 2000's | 115 | 112 | 112 | 106 | 113 | 108 | 107 | 107 | 100 | 99 |
| 2010's | 104 | 108 | 108 | 107 | 111 | 112 | 115 | 117 | 116 | 114 |
| 2020's | 110 | 116 | -- | -- |
| - = No Data Reported; -- = Not Applicable; NA = Not Available; W = Withheld to avoid disclosure of individual company data. |
| Release Date: 8/30/2024 |
| Next Release Date: 8/29/2025 |