|
Download Data (XLS File) |
|
||||||||
|
||||||||
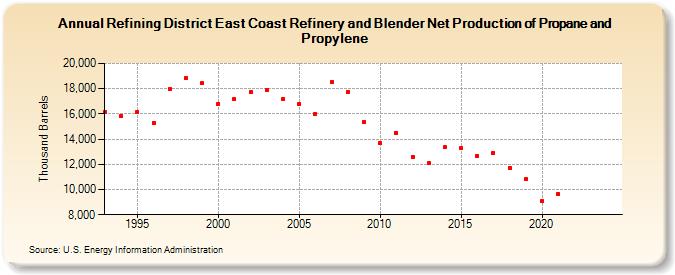
| Refining District East Coast Refinery and Blender Net Production of Propane and Propylene (Thousand Barrels) | ||||||||
| Decade | Year-0 | Year-1 | Year-2 | Year-3 | Year-4 | Year-5 | Year-6 | Year-7 | Year-8 | Year-9 |
|---|---|---|---|---|---|---|---|---|---|---|
| 1990's | 16,145 | 15,860 | 16,182 | 15,298 | 17,986 | 18,838 | 18,413 | |||
| 2000's | 16,816 | 17,146 | 17,753 | 17,913 | 17,215 | 16,818 | 16,017 | 18,530 | 17,718 | 15,383 |
| 2010's | 13,658 | 14,506 | 12,606 | 12,085 | 13,346 | 13,256 | 12,670 | 12,913 | 11,745 | 10,829 |
| 2020's | 9,097 | 9,678 | -- | -- |
| - = No Data Reported; -- = Not Applicable; NA = Not Available; W = Withheld to avoid disclosure of individual company data. |
| Release Date: 3/29/2024 |
| Next Release Date: 8/30/2024 |