|
Download Data (XLS File) |
|
||||||||
|
||||||||
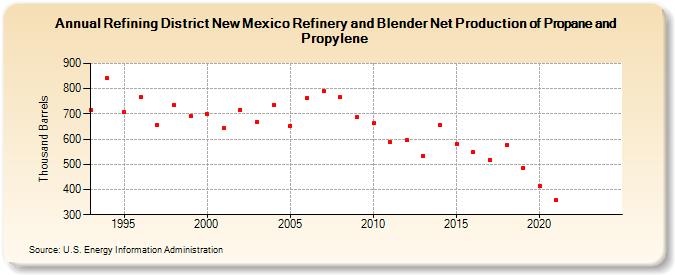
| Refining District New Mexico Refinery and Blender Net Production of Propane and Propylene (Thousand Barrels) | ||||||||
| Decade | Year-0 | Year-1 | Year-2 | Year-3 | Year-4 | Year-5 | Year-6 | Year-7 | Year-8 | Year-9 |
|---|---|---|---|---|---|---|---|---|---|---|
| 1990's | 715 | 841 | 706 | 767 | 657 | 735 | 690 | |||
| 2000's | 699 | 643 | 717 | 668 | 737 | 653 | 762 | 791 | 767 | 686 |
| 2010's | 662 | 588 | 596 | 534 | 654 | 579 | 547 | 519 | 576 | 487 |
| 2020's | 415 | 358 | -- | -- |
| - = No Data Reported; -- = Not Applicable; NA = Not Available; W = Withheld to avoid disclosure of individual company data. |
| Release Date: 3/29/2024 |
| Next Release Date: 8/30/2024 |