|
Download Data (XLS File) |
|
||||||||
|
||||||||
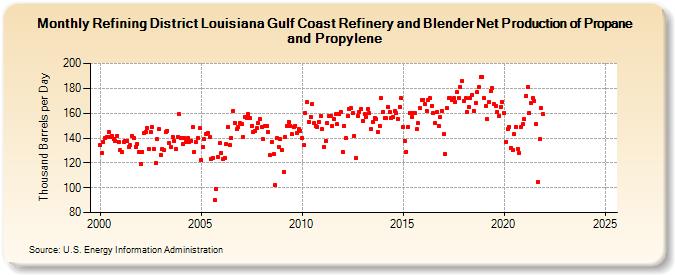
| Refining District Louisiana Gulf Coast Refinery and Blender Net Production of Propane and Propylene (Thousand Barrels per Day) | ||||||||
| Year | Jan | Feb | Mar | Apr | May | Jun | Jul | Aug | Sep | Oct | Nov | Dec |
|---|---|---|---|---|---|---|---|---|---|---|---|---|
| 2000 | 134 | 128 | 137 | 140 | 141 | 145 | 141 | 142 | 139 | 138 | 142 | 137 |
| 2001 | 130 | 129 | 137 | 138 | 138 | 133 | 134 | 142 | 140 | 133 | 135 | 129 |
| 2002 | 119 | 129 | 144 | 145 | 148 | 131 | 145 | 149 | 131 | 120 | 139 | 147 |
| 2003 | 126 | 131 | 130 | 145 | 146 | 136 | 133 | 141 | 138 | 131 | 141 | 159 |
| 2004 | 140 | 135 | 140 | 137 | 140 | 137 | 138 | 149 | 129 | 137 | 140 | 148 |
| 2005 | 122 | 133 | 139 | 143 | 144 | 141 | 123 | 124 | 90 | 99 | 125 | 136 |
| 2006 | 128 | 123 | 124 | 135 | 149 | 134 | 140 | 162 | 152 | 147 | 149 | 152 |
| 2007 | 151 | 141 | 157 | 156 | 159 | 156 | 150 | 145 | 146 | 148 | 152 | 155 |
| 2008 | 149 | 139 | 150 | 150 | 145 | 126 | 137 | 127 | 102 | 140 | 133 | 139 |
| 2009 | 130 | 113 | 141 | 150 | 153 | 150 | 143 | 149 | 150 | 144 | 147 | 146 |
| 2010 | 140 | 134 | 160 | 169 | 153 | 157 | 167 | 152 | 150 | 149 | 153 | 158 |
| 2011 | 147 | 133 | 138 | 152 | 158 | 158 | 150 | 155 | 159 | 151 | 159 | 161 |
| 2012 | 129 | 150 | 140 | 158 | 163 | 164 | 160 | 142 | 124 | 158 | 161 | 163 |
| 2013 | 154 | 159 | 157 | 163 | 160 | 147 | 153 | 156 | 155 | 145 | 150 | 172 |
| 2014 | 161 | 156 | 156 | 165 | 161 | 156 | 157 | 162 | 160 | 155 | 165 | 172 |
| 2015 | 149 | 138 | 129 | 149 | 160 | 157 | 160 | 160 | 147 | 152 | 164 | 171 |
| 2016 | 171 | 167 | 162 | 171 | 172 | 166 | 160 | 152 | 161 | 150 | 157 | 162 |
| 2017 | 143 | 127 | 164 | 172 | 172 | 171 | 172 | 169 | 177 | 172 | 181 | 186 |
| 2018 | 170 | 172 | 161 | 165 | 172 | 175 | 162 | 168 | 177 | 181 | 189 | 189 |
| 2019 | 172 | 166 | 155 | 169 | 178 | 180 | 167 | 166 | 161 | 158 | 165 | 169 |
| 2020 | 160 | 137 | 147 | 149 | 132 | 130 | 143 | 149 | 131 | 128 | 149 | 151 |
| 2021 | 155 | 174 | 181 | 160 | 168 | 172 | 170 | 151 | 105 | 139 | 164 | 159 |
| 2022 | -- | -- | -- | -- | -- | -- | -- | -- | -- | -- | -- | -- |
| 2023 | -- | -- | -- | -- | -- | -- | -- | -- | -- | -- | -- | -- |
| 2024 | -- | |||||||||||
| - = No Data Reported; -- = Not Applicable; NA = Not Available; W = Withheld to avoid disclosure of individual company data. |
| Release Date: 3/29/2024 |
| Next Release Date: 4/30/2024 |