|
Download Data (XLS File) |
|
||||||||
|
||||||||
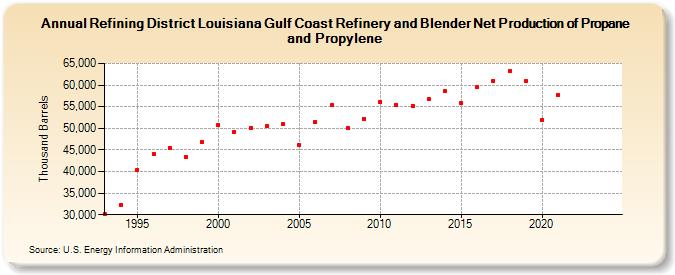
| Refining District Louisiana Gulf Coast Refinery and Blender Net Production of Propane and Propylene (Thousand Barrels) | ||||||||
| Decade | Year-0 | Year-1 | Year-2 | Year-3 | Year-4 | Year-5 | Year-6 | Year-7 | Year-8 | Year-9 |
|---|---|---|---|---|---|---|---|---|---|---|
| 1990's | 30,148 | 32,332 | 40,438 | 44,124 | 45,515 | 43,385 | 46,919 | |||
| 2000's | 50,760 | 49,205 | 50,123 | 50,460 | 50,937 | 46,196 | 51,550 | 55,305 | 49,967 | 52,258 |
| 2010's | 56,116 | 55,459 | 55,267 | 56,884 | 58,562 | 55,881 | 59,452 | 61,051 | 63,300 | 60,950 |
| 2020's | 52,030 | 57,756 | -- | -- |
| - = No Data Reported; -- = Not Applicable; NA = Not Available; W = Withheld to avoid disclosure of individual company data. |
| Release Date: 6/28/2024 |
| Next Release Date: 8/30/2024 |