|
Download Data (XLS File) |
|
||||||||
|
||||||||
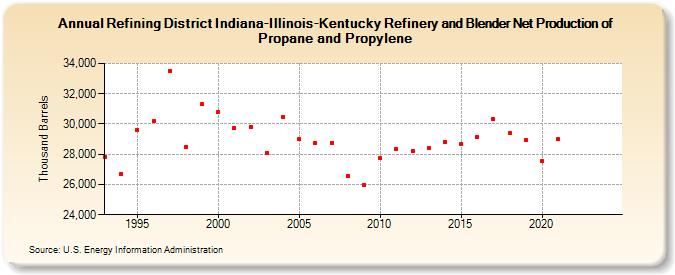
| Refining District Indiana-Illinois-Kentucky Refinery and Blender Net Production of Propane and Propylene (Thousand Barrels) | ||||||||
| Decade | Year-0 | Year-1 | Year-2 | Year-3 | Year-4 | Year-5 | Year-6 | Year-7 | Year-8 | Year-9 |
|---|---|---|---|---|---|---|---|---|---|---|
| 1990's | 27,828 | 26,712 | 29,630 | 30,204 | 33,513 | 28,478 | 31,297 | |||
| 2000's | 30,794 | 29,765 | 29,808 | 28,066 | 30,465 | 28,991 | 28,739 | 28,767 | 26,567 | 25,968 |
| 2010's | 27,721 | 28,355 | 28,210 | 28,390 | 28,822 | 28,678 | 29,135 | 30,306 | 29,374 | 28,920 |
| 2020's | 27,583 | 29,006 | -- | -- |
| - = No Data Reported; -- = Not Applicable; NA = Not Available; W = Withheld to avoid disclosure of individual company data. |
| Release Date: 3/29/2024 |
| Next Release Date: 8/30/2024 |