|
Download Data (XLS File) |
|
||||||||
|
||||||||
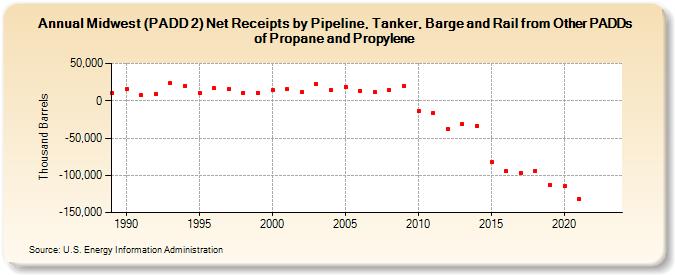
| Midwest (PADD 2) Net Receipts by Pipeline, Tanker, Barge and Rail from Other PADDs of Propane and Propylene (Thousand Barrels) | ||||||||
| Decade | Year-0 | Year-1 | Year-2 | Year-3 | Year-4 | Year-5 | Year-6 | Year-7 | Year-8 | Year-9 |
|---|---|---|---|---|---|---|---|---|---|---|
| 1980's | 10,612 | |||||||||
| 1990's | 15,600 | 7,375 | 9,307 | 23,612 | 20,209 | 10,206 | 16,695 | 15,991 | 10,857 | 11,056 |
| 2000's | 14,322 | 15,300 | 11,274 | 22,254 | 14,481 | 18,893 | 13,569 | 11,151 | 14,572 | 19,837 |
| 2010's | -13,855 | -16,032 | -37,355 | -31,442 | -34,139 | -82,305 | -94,101 | -96,412 | -93,755 | -112,669 |
| 2020's | -114,729 | -131,980 | -- | -- | -- |
| - = No Data Reported; -- = Not Applicable; NA = Not Available; W = Withheld to avoid disclosure of individual company data. |
| Release Date: 6/30/2025 |
| Next Release Date: 8/29/2025 |