|
Download Data (XLS File) |
|
||||||||
|
||||||||
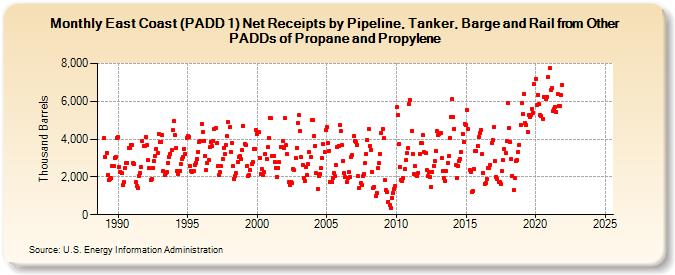
| East Coast (PADD 1) Net Receipts by Pipeline, Tanker, Barge and Rail from Other PADDs of Propane and Propylene (Thousand Barrels) | ||||||||
| Year | Jan | Feb | Mar | Apr | May | Jun | Jul | Aug | Sep | Oct | Nov | Dec |
|---|---|---|---|---|---|---|---|---|---|---|---|---|
| 1989 | 4,047 | 3,027 | 3,285 | 2,105 | 1,810 | 1,863 | 1,927 | 2,592 | 2,559 | 3,021 | 3,069 | 4,080 |
| 1990 | 4,100 | 2,548 | 2,273 | 2,184 | 1,552 | 1,709 | 2,469 | 2,733 | 2,725 | 3,549 | 3,509 | 3,691 |
| 1991 | 3,708 | 2,762 | 2,705 | 1,715 | 1,494 | 1,438 | 2,041 | 2,200 | 2,503 | 3,894 | 3,661 | 3,659 |
| 1992 | 4,131 | 3,670 | 2,890 | 2,467 | 1,820 | 1,863 | 2,464 | 2,845 | 3,124 | 3,495 | 3,241 | 4,278 |
| 1993 | 3,840 | 3,869 | 4,196 | 2,313 | 2,110 | 2,215 | 2,240 | 2,726 | 3,051 | 3,232 | 3,421 | 4,466 |
| 1994 | 4,943 | 4,212 | 3,541 | 2,307 | 2,162 | 2,306 | 2,665 | 2,934 | 3,053 | 3,495 | 3,227 | 4,080 |
| 1995 | 4,153 | 4,136 | 2,603 | 2,324 | 2,265 | 2,302 | 2,648 | 2,762 | 2,958 | 3,342 | 3,867 | 3,899 |
| 1996 | 4,811 | 4,379 | 3,923 | 3,094 | 2,353 | 2,728 | 2,881 | 3,557 | 3,851 | 3,609 | 3,923 | 4,522 |
| 1997 | 4,594 | 3,780 | 2,554 | 2,098 | 2,241 | 2,568 | 2,939 | 3,531 | 3,187 | 3,682 | 4,145 | 4,879 |
| 1998 | 4,630 | 3,339 | 3,801 | 2,562 | 1,903 | 2,061 | 2,189 | 2,773 | 3,044 | 3,094 | 2,931 | 3,409 |
| 1999 | 4,683 | 3,760 | 3,662 | 2,560 | 2,024 | 2,109 | 2,360 | 2,691 | 2,787 | 3,464 | 3,468 | 4,474 |
| 2000 | 4,296 | 4,376 | 3,013 | 2,136 | 2,409 | 2,112 | 2,239 | 3,205 | 2,965 | 3,574 | 4,072 | 5,124 |
| 2001 | 5,090 | 3,122 | 3,120 | 2,766 | 2,475 | 2,004 | 2,480 | 2,767 | 3,582 | 3,576 | 3,902 | 3,533 |
| 2002 | 5,100 | 3,670 | 3,193 | 1,730 | 1,588 | 1,752 | 1,698 | 2,419 | 2,349 | 2,988 | 3,550 | 4,854 |
| 2003 | 5,252 | 4,429 | 3,039 | 2,655 | 1,929 | 1,799 | 2,522 | 2,099 | 2,674 | 3,339 | 3,055 | 5,009 |
| 2004 | 4,994 | 4,155 | 3,656 | 2,181 | 1,362 | 2,069 | 2,153 | 2,466 | 2,989 | 3,731 | 3,317 | 4,455 |
| 2005 | 4,639 | 3,800 | 3,384 | 1,741 | 1,745 | 1,956 | 2,231 | 2,030 | 2,638 | 3,595 | 3,652 | 4,739 |
| 2006 | 4,416 | 3,677 | 2,855 | 2,202 | 1,991 | 1,744 | 1,938 | 2,275 | 2,015 | 3,067 | 3,154 | 4,146 |
| 2007 | 3,914 | 3,859 | 3,693 | 2,022 | 1,395 | 1,671 | 1,567 | 2,023 | 2,162 | 2,712 | 3,206 | 3,975 |
| 2008 | 4,559 | 3,652 | 3,439 | 2,264 | 1,405 | 1,471 | 984 | 1,170 | 2,452 | 2,722 | 3,224 | 4,331 |
| 2009 | 4,554 | 4,040 | 1,836 | 1,303 | 1,184 | 699 | 540 | 334 | 903 | 1,142 | 1,380 | 1,500 |
| 2010 | 5,674 | 5,277 | 3,748 | 2,526 | 1,859 | 1,807 | 1,931 | 2,416 | 2,881 | 3,242 | 3,515 | 5,850 |
| 2011 | 6,050 | 4,448 | 3,225 | 2,151 | 2,578 | 2,085 | 2,037 | 2,211 | 3,209 | 3,784 | 3,790 | 4,206 |
| 2012 | 3,330 | 3,247 | 2,364 | 2,034 | 2,257 | 2,008 | 1,476 | 2,265 | 2,594 | 2,820 | 3,364 | 4,441 |
| 2013 | 4,191 | 4,289 | 4,332 | 3,018 | 2,314 | 1,938 | 1,784 | 2,297 | 2,730 | 3,082 | 4,075 | 5,170 |
| 2014 | 6,096 | 5,191 | 4,551 | 2,608 | 1,951 | 2,594 | 2,853 | 2,948 | 3,314 | 4,290 | 3,848 | 4,803 |
| 2015 | 4,764 | 5,528 | 4,519 | 2,345 | 2,266 | 1,186 | 1,237 | 2,439 | 3,391 | 3,353 | 3,635 | 4,134 |
| 2016 | 4,334 | 4,501 | 3,205 | 2,227 | 1,639 | 1,677 | 1,904 | 2,477 | 2,476 | 2,649 | 3,775 | 3,948 |
| 2017 | 4,639 | 2,857 | 2,013 | 1,903 | 1,724 | 1,712 | 1,613 | 2,325 | 2,874 | 3,489 | 3,269 | 3,900 |
| 2018 | 5,887 | 4,565 | 3,843 | 2,926 | 2,069 | 1,308 | 1,955 | 2,837 | 2,875 | 3,324 | 3,714 | 4,759 |
| 2019 | 5,895 | 5,319 | 6,399 | 4,855 | 4,742 | 4,383 | 5,254 | 5,191 | 5,283 | 5,610 | 5,383 | 6,898 |
| 2020 | 7,199 | 5,808 | 6,333 | 5,833 | 5,252 | 5,221 | 5,085 | 6,245 | 6,253 | 6,112 | 6,227 | 7,261 |
| 2021 | 7,755 | 6,590 | 6,685 | 5,472 | 5,571 | 5,694 | 5,430 | 6,360 | 5,769 | 5,754 | 6,312 | 6,873 |
| 2022 | -- | -- | -- | -- | -- | -- | -- | -- | -- | -- | -- | -- |
| 2023 | -- | -- | -- | -- | -- | -- | -- | -- | -- | -- | -- | -- |
| 2024 | -- | |||||||||||
| - = No Data Reported; -- = Not Applicable; NA = Not Available; W = Withheld to avoid disclosure of individual company data. |
| Release Date: 3/29/2024 |
| Next Release Date: 4/30/2024 |