|
Download Data (XLS File) |
|
||||||||
|
||||||||
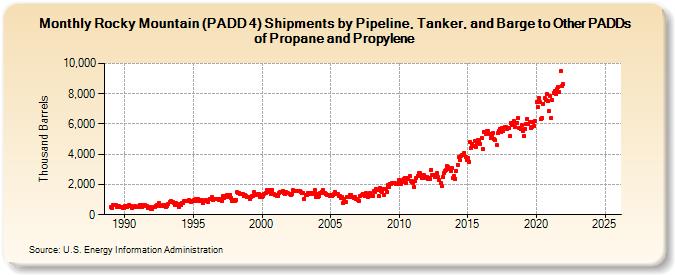
| Rocky Mountain (PADD 4) Shipments by Pipeline, Tanker, and Barge to Other PADDs of Propane and Propylene (Thousand Barrels) | ||||||||
| Year | Jan | Feb | Mar | Apr | May | Jun | Jul | Aug | Sep | Oct | Nov | Dec |
|---|---|---|---|---|---|---|---|---|---|---|---|---|
| 1989 | 501 | 470 | 620 | 636 | 634 | 535 | 563 | 544 | 480 | 490 | 456 | 467 |
| 1990 | 601 | 594 | 478 | 608 | 648 | 549 | 432 | 542 | 481 | 545 | 515 | 486 |
| 1991 | 546 | 649 | 637 | 535 | 603 | 655 | 615 | 568 | 445 | 444 | 512 | 407 |
| 1992 | 410 | 506 | 534 | 588 | 635 | 613 | 764 | 603 | 555 | 618 | 603 | 626 |
| 1993 | 504 | 575 | 683 | 850 | 884 | 858 | 828 | 763 | 666 | 762 | 654 | 543 |
| 1994 | 703 | 624 | 807 | 761 | 888 | 914 | 906 | 902 | 945 | 904 | 848 | 907 |
| 1995 | 955 | 882 | 1,037 | 1,026 | 1,032 | 911 | 940 | 988 | 807 | 908 | 878 | 965 |
| 1996 | 879 | 835 | 1,070 | 1,050 | 1,164 | 984 | 1,008 | 1,035 | 1,037 | 1,028 | 979 | 1,007 |
| 1997 | 1,011 | 935 | 1,263 | 1,082 | 1,263 | 1,271 | 1,184 | 1,166 | 1,329 | 1,118 | 910 | 983 |
| 1998 | 933 | 989 | 1,485 | 1,443 | 1,443 | 1,366 | 1,375 | 1,343 | 1,211 | 1,329 | 1,251 | 1,165 |
| 1999 | 1,140 | 1,052 | 1,179 | 1,235 | 1,217 | 1,471 | 1,297 | 1,309 | 1,373 | 1,387 | 1,202 | 1,306 |
| 2000 | 1,163 | 1,241 | 1,375 | 1,431 | 1,607 | 1,572 | 1,642 | 1,532 | 1,380 | 1,621 | 1,382 | 1,314 |
| 2001 | 1,302 | 1,219 | 1,228 | 1,454 | 1,493 | 1,476 | 1,552 | 1,413 | 1,366 | 1,474 | 1,448 | 1,413 |
| 2002 | 1,376 | 1,286 | 1,402 | 1,613 | 1,580 | 1,571 | 1,576 | 1,591 | 1,542 | 1,538 | 1,496 | 1,433 |
| 2003 | 1,444 | 1,053 | 1,322 | 1,297 | 1,439 | 1,388 | 1,464 | 1,462 | 1,382 | 1,452 | 1,614 | 1,203 |
| 2004 | 1,375 | 1,152 | 1,255 | 1,443 | 1,532 | 1,639 | 1,440 | 1,444 | 1,397 | 1,324 | 1,330 | 1,251 |
| 2005 | 1,272 | 1,223 | 1,276 | 1,339 | 1,518 | 1,394 | 1,363 | 1,245 | 1,236 | 1,127 | 1,139 | 765 |
| 2006 | 1,007 | 852 | 1,141 | 1,150 | 1,204 | 1,315 | 1,296 | 1,188 | 1,116 | 1,149 | 1,054 | 1,012 |
| 2007 | 941 | 914 | 1,211 | 1,289 | 1,382 | 1,332 | 1,244 | 1,420 | 1,230 | 1,200 | 1,442 | 1,287 |
| 2008 | 1,255 | 1,267 | 1,543 | 1,534 | 1,693 | 1,628 | 1,218 | 1,766 | 1,572 | 1,513 | 1,681 | 1,322 |
| 2009 | 1,718 | 1,494 | 1,946 | 1,804 | 2,042 | 2,043 | 2,099 | 2,106 | 2,103 | 2,024 | 2,032 | 2,031 |
| 2010 | 2,318 | 2,034 | 2,161 | 2,300 | 2,392 | 2,409 | 2,077 | 2,399 | 2,329 | 2,548 | 2,243 | 2,188 |
| 2011 | 2,128 | 1,857 | 2,260 | 2,435 | 2,563 | 2,726 | 2,728 | 2,609 | 2,429 | 2,558 | 2,596 | 2,431 |
| 2012 | 2,511 | 2,392 | 2,458 | 2,393 | 2,977 | 2,622 | 2,646 | 2,498 | 2,524 | 2,741 | 2,467 | 2,304 |
| 2013 | 2,109 | 1,867 | 2,498 | 2,758 | 2,871 | 2,944 | 3,218 | 3,146 | 3,038 | 2,892 | 3,112 | 2,457 |
| 2014 | 2,578 | 2,365 | 2,886 | 3,311 | 3,810 | 3,587 | 3,869 | 3,927 | 3,957 | 4,088 | 3,817 | 3,629 |
| 2015 | 3,778 | 3,516 | 4,784 | 4,409 | 4,694 | 4,541 | 4,869 | 4,464 | 4,715 | 4,959 | 4,902 | 4,696 |
| 2016 | 5,081 | 4,333 | 5,459 | 5,454 | 5,346 | 5,549 | 5,535 | 5,356 | 5,071 | 5,285 | 5,418 | 4,993 |
| 2017 | 4,923 | 4,616 | 5,377 | 5,536 | 5,694 | 5,455 | 5,740 | 5,550 | 5,792 | 5,776 | 5,686 | 5,766 |
| 2018 | 5,710 | 5,210 | 6,057 | 5,962 | 6,213 | 5,815 | 6,092 | 6,073 | 6,387 | 5,737 | 5,644 | 5,930 |
| 2019 | 5,537 | 5,193 | 5,695 | 6,027 | 6,331 | 5,975 | 6,132 | 5,706 | 5,827 | 6,120 | 5,878 | 6,227 |
| 2020 | 7,484 | 7,096 | 7,717 | 7,443 | 6,300 | 6,422 | 7,339 | 7,690 | 7,613 | 7,996 | 7,493 | 6,873 |
| 2021 | 7,834 | 6,413 | 7,560 | 8,072 | 8,177 | 7,970 | 8,292 | 8,471 | 8,104 | 9,493 | 8,521 | 8,641 |
| 2022 | -- | -- | -- | -- | -- | -- | -- | -- | -- | -- | -- | -- |
| 2023 | -- | -- | -- | -- | -- | -- | -- | -- | -- | -- | -- | -- |
| 2024 | -- | |||||||||||
| - = No Data Reported; -- = Not Applicable; NA = Not Available; W = Withheld to avoid disclosure of individual company data. |
| Release Date: 3/29/2024 |
| Next Release Date: 4/30/2024 |