|
Download Data (XLS File) |
|
||||||||
|
||||||||
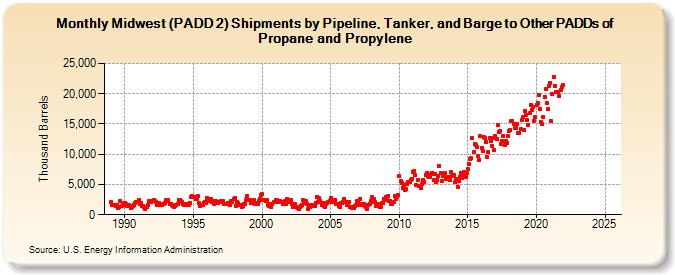
| Midwest (PADD 2) Shipments by Pipeline, Tanker, and Barge to Other PADDs of Propane and Propylene (Thousand Barrels) | ||||||||
| Year | Jan | Feb | Mar | Apr | May | Jun | Jul | Aug | Sep | Oct | Nov | Dec |
|---|---|---|---|---|---|---|---|---|---|---|---|---|
| 1989 | 2,093 | 1,590 | 1,655 | 1,530 | 1,483 | 1,620 | 1,102 | 1,305 | 2,266 | 1,389 | 1,555 | 1,922 |
| 1990 | 1,868 | 1,803 | 1,486 | 1,472 | 1,645 | 1,178 | 1,235 | 1,435 | 1,675 | 1,973 | 2,057 | 2,084 |
| 1991 | 2,406 | 1,818 | 1,861 | 1,456 | 1,402 | 1,256 | 1,012 | 1,237 | 1,548 | 2,236 | 2,103 | 2,100 |
| 1992 | 2,286 | 2,466 | 2,251 | 2,101 | 1,655 | 1,605 | 1,893 | 1,565 | 1,527 | 1,716 | 1,735 | 1,937 |
| 1993 | 2,357 | 2,335 | 2,408 | 1,758 | 1,832 | 1,577 | 1,495 | 1,235 | 1,373 | 1,542 | 1,794 | 2,449 |
| 1994 | 2,460 | 2,188 | 2,113 | 1,786 | 1,646 | 1,762 | 1,708 | 1,552 | 1,625 | 1,922 | 2,990 | 3,015 |
| 1995 | 2,951 | 2,910 | 2,648 | 2,662 | 3,065 | 1,857 | 1,402 | 1,635 | 1,571 | 1,993 | 2,169 | 1,948 |
| 1996 | 2,761 | 2,206 | 2,592 | 2,656 | 2,046 | 2,234 | 1,772 | 1,927 | 2,196 | 1,935 | 2,166 | 2,103 |
| 1997 | 2,342 | 2,332 | 2,246 | 1,783 | 1,783 | 1,817 | 1,919 | 1,845 | 1,601 | 2,283 | 2,153 | 2,578 |
| 1998 | 2,792 | 1,436 | 2,155 | 1,932 | 1,676 | 1,628 | 1,291 | 1,427 | 1,814 | 1,763 | 2,362 | 3,136 |
| 1999 | 2,511 | 2,390 | 1,916 | 1,966 | 2,142 | 2,503 | 1,748 | 1,969 | 1,719 | 2,222 | 2,623 | 3,199 |
| 2000 | 3,369 | 2,506 | 2,466 | 2,208 | 2,506 | 1,590 | 1,508 | 1,708 | 1,348 | 1,792 | 2,047 | 2,146 |
| 2001 | 2,356 | 2,391 | 2,180 | 2,239 | 2,197 | 2,037 | 1,841 | 1,960 | 2,188 | 1,752 | 2,566 | 2,155 |
| 2002 | 2,170 | 2,375 | 1,739 | 1,236 | 1,698 | 1,720 | 1,316 | 1,067 | 985 | 1,264 | 1,508 | 1,582 |
| 2003 | 2,499 | 1,946 | 2,194 | 1,791 | 982 | 1,279 | 1,216 | 1,627 | 1,535 | 1,402 | 1,468 | 2,000 |
| 2004 | 2,967 | 2,152 | 2,788 | 2,292 | 1,637 | 1,907 | 1,514 | 1,205 | 1,832 | 2,012 | 2,145 | 2,266 |
| 2005 | 2,750 | 2,086 | 2,084 | 2,288 | 2,457 | 1,689 | 1,772 | 1,460 | 1,238 | 1,910 | 1,909 | 2,129 |
| 2006 | 2,607 | 2,104 | 1,593 | 1,997 | 2,105 | 1,218 | 1,330 | 1,179 | 1,161 | 1,373 | 1,623 | 2,313 |
| 2007 | 2,151 | 1,588 | 2,659 | 1,835 | 1,529 | 1,723 | 1,459 | 1,279 | 1,027 | 1,572 | 1,811 | 2,248 |
| 2008 | 2,894 | 2,036 | 2,554 | 2,135 | 1,497 | 1,726 | 1,611 | 1,346 | 1,328 | 1,976 | 1,977 | 2,634 |
| 2009 | 2,963 | 2,460 | 3,067 | 2,216 | 2,269 | 1,835 | 1,845 | 2,064 | 3,034 | 2,648 | 2,978 | 3,221 |
| 2010 | 6,322 | 5,531 | 5,258 | 4,460 | 4,842 | 4,127 | 4,248 | 5,158 | 5,423 | 5,339 | 5,755 | 5,890 |
| 2011 | 7,053 | 7,145 | 6,543 | 4,975 | 5,721 | 4,726 | 4,674 | 4,449 | 5,056 | 5,820 | 5,415 | 6,579 |
| 2012 | 6,956 | 6,352 | 6,159 | 6,287 | 6,742 | 6,965 | 5,670 | 6,718 | 5,442 | 5,777 | 6,329 | 8,097 |
| 2013 | 6,889 | 5,586 | 6,442 | 6,517 | 6,870 | 5,984 | 6,000 | 6,296 | 5,742 | 7,090 | 6,353 | 6,544 |
| 2014 | 6,499 | 5,437 | 5,863 | 4,634 | 5,640 | 6,243 | 6,909 | 6,079 | 6,645 | 7,083 | 6,252 | 6,910 |
| 2015 | 7,550 | 8,370 | 9,237 | 9,298 | 12,690 | 10,374 | 11,671 | 11,578 | 11,250 | 9,763 | 9,047 | 12,973 |
| 2016 | 11,107 | 10,501 | 12,822 | 12,748 | 12,027 | 9,490 | 10,360 | 12,701 | 12,165 | 11,387 | 12,659 | 10,661 |
| 2017 | 12,993 | 12,463 | 14,776 | 13,606 | 13,824 | 11,754 | 12,184 | 12,975 | 11,463 | 12,218 | 11,785 | 13,003 |
| 2018 | 13,839 | 14,000 | 15,420 | 15,528 | 15,075 | 14,329 | 14,373 | 15,011 | 13,443 | 13,585 | 14,125 | 15,582 |
| 2019 | 16,109 | 13,976 | 17,065 | 16,431 | 15,595 | 14,850 | 16,756 | 18,146 | 17,282 | 17,878 | 15,566 | 16,207 |
| 2020 | 18,201 | 18,434 | 19,840 | 17,414 | 15,260 | 14,985 | 16,201 | 19,501 | 20,800 | 18,445 | 17,402 | 21,257 |
| 2021 | 21,792 | 15,426 | 19,905 | 22,829 | 21,325 | 20,247 | 20,204 | 20,289 | 19,644 | 20,636 | 21,074 | 21,435 |
| 2022 | -- | -- | -- | -- | -- | -- | -- | -- | -- | -- | -- | -- |
| 2023 | -- | -- | -- | -- | -- | -- | -- | -- | -- | -- | -- | -- |
| 2024 | -- | |||||||||||
| - = No Data Reported; -- = Not Applicable; NA = Not Available; W = Withheld to avoid disclosure of individual company data. |
| Release Date: 3/29/2024 |
| Next Release Date: 4/30/2024 |