|
Download Data (XLS File) |
|
||||||||
|
||||||||
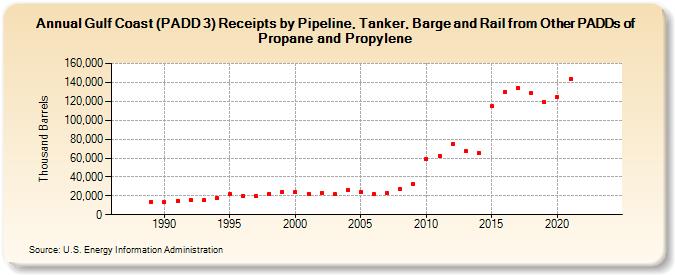
| Gulf Coast (PADD 3) Receipts by Pipeline, Tanker, Barge and Rail from Other PADDs of Propane and Propylene (Thousand Barrels) | ||||||||
| Decade | Year-0 | Year-1 | Year-2 | Year-3 | Year-4 | Year-5 | Year-6 | Year-7 | Year-8 | Year-9 |
|---|---|---|---|---|---|---|---|---|---|---|
| 1980's | -- | -- | -- | 13,860 | ||||||
| 1990's | 13,187 | 14,982 | 15,742 | 15,135 | 17,419 | 21,874 | 19,677 | 19,672 | 21,981 | 24,345 |
| 2000's | 24,107 | 22,232 | 23,395 | 21,860 | 26,402 | 24,147 | 21,600 | 23,103 | 26,977 | 32,464 |
| 2010's | 58,903 | 62,616 | 74,345 | 66,997 | 65,364 | 114,750 | 130,005 | 134,381 | 128,588 | 119,178 |
| 2020's | 124,772 | 143,903 | -- | -- |
| - = No Data Reported; -- = Not Applicable; NA = Not Available; W = Withheld to avoid disclosure of individual company data. |
| Release Date: 3/29/2024 |
| Next Release Date: 8/30/2024 |