|
Download Data (XLS File) |
|
||||||||
|
||||||||
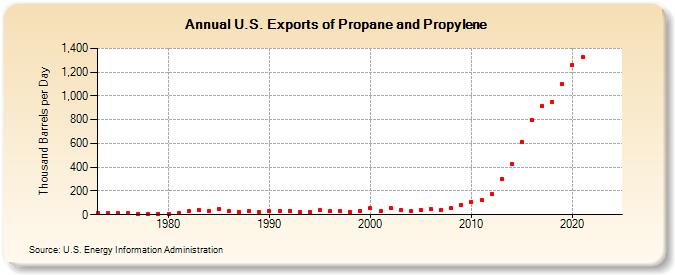
| U.S. Exports of Propane and Propylene (Thousand Barrels per Day) | ||||||||
| Decade | Year-0 | Year-1 | Year-2 | Year-3 | Year-4 | Year-5 | Year-6 | Year-7 | Year-8 | Year-9 |
|---|---|---|---|---|---|---|---|---|---|---|
| 1970's | 15 | 14 | 13 | 13 | 10 | 9 | 8 | |||
| 1980's | 10 | 18 | 31 | 43 | 30 | 48 | 28 | 24 | 31 | 24 |
| 1990's | 28 | 28 | 33 | 26 | 24 | 38 | 28 | 32 | 25 | 33 |
| 2000's | 53 | 31 | 55 | 37 | 28 | 37 | 45 | 42 | 53 | 85 |
| 2010's | 109 | 124 | 171 | 302 | 423 | 615 | 799 | 914 | 949 | 1,098 |
| 2020's | 1,262 | 1,327 | -- | -- |
| - = No Data Reported; -- = Not Applicable; NA = Not Available; W = Withheld to avoid disclosure of individual company data. |
| Release Date: 3/29/2024 |
| Next Release Date: 8/30/2024 |