|
Download Data (XLS File) |
|
||||||||
|
||||||||
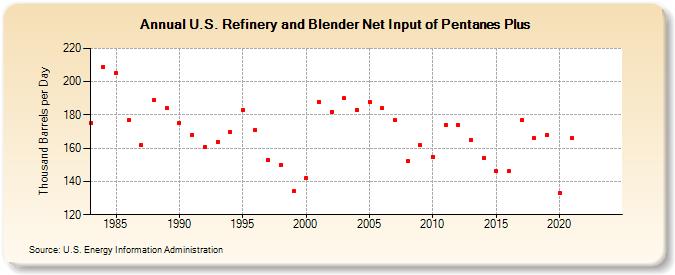
| U.S. Refinery and Blender Net Input of Pentanes Plus (Thousand Barrels per Day) | ||||||||
| Decade | Year-0 | Year-1 | Year-2 | Year-3 | Year-4 | Year-5 | Year-6 | Year-7 | Year-8 | Year-9 |
|---|---|---|---|---|---|---|---|---|---|---|
| 1980's | 175 | 209 | 205 | 177 | 162 | 189 | 184 | |||
| 1990's | 175 | 168 | 161 | 164 | 170 | 183 | 171 | 153 | 150 | 134 |
| 2000's | 142 | 188 | 182 | 190 | 183 | 188 | 184 | 177 | 152 | 162 |
| 2010's | 155 | 174 | 174 | 165 | 154 | 146 | 146 | 177 | 166 | 168 |
| 2020's | 133 | 166 | -- | -- |
| - = No Data Reported; -- = Not Applicable; NA = Not Available; W = Withheld to avoid disclosure of individual company data. |
| Release Date: 6/28/2024 |
| Next Release Date: 8/30/2024 |