|
Download Data (XLS File) |
|
||||||||
|
||||||||
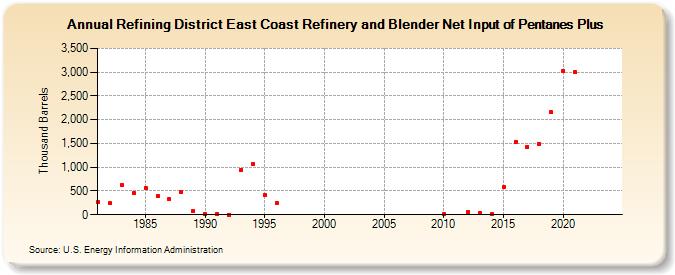
| Refining District East Coast Refinery and Blender Net Input of Pentanes Plus (Thousand Barrels) | ||||||||
| Decade | Year-0 | Year-1 | Year-2 | Year-3 | Year-4 | Year-5 | Year-6 | Year-7 | Year-8 | Year-9 |
|---|---|---|---|---|---|---|---|---|---|---|
| 1980's | 260 | 238 | 627 | 460 | 567 | 401 | 324 | 484 | 74 | |
| 1990's | 12 | 14 | 0 | 942 | 1,075 | 417 | 255 | |||
| 2010's | 8 | 63 | 27 | 5 | 583 | 1,539 | 1,423 | 1,489 | 2,156 | |
| 2020's | 3,021 | 3,002 | -- | -- |
| - = No Data Reported; -- = Not Applicable; NA = Not Available; W = Withheld to avoid disclosure of individual company data. |
| Release Date: 3/29/2024 |
| Next Release Date: 8/30/2024 |