|
Download Data (XLS File) |
|
||||||||
|
||||||||
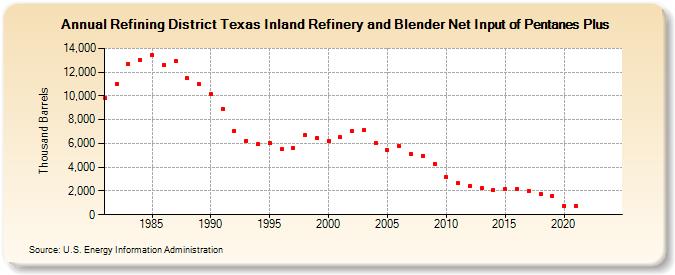
| Refining District Texas Inland Refinery and Blender Net Input of Pentanes Plus (Thousand Barrels) | ||||||||
| Decade | Year-0 | Year-1 | Year-2 | Year-3 | Year-4 | Year-5 | Year-6 | Year-7 | Year-8 | Year-9 |
|---|---|---|---|---|---|---|---|---|---|---|
| 1980's | 9,806 | 11,010 | 12,673 | 13,030 | 13,418 | 12,630 | 12,924 | 11,477 | 10,972 | |
| 1990's | 10,154 | 8,931 | 7,068 | 6,240 | 5,928 | 6,052 | 5,508 | 5,620 | 6,677 | 6,433 |
| 2000's | 6,182 | 6,502 | 7,015 | 7,168 | 6,038 | 5,407 | 5,766 | 5,142 | 4,971 | 4,290 |
| 2010's | 3,161 | 2,656 | 2,427 | 2,244 | 2,100 | 2,129 | 2,174 | 1,993 | 1,767 | 1,578 |
| 2020's | 769 | 758 | -- | -- |
| - = No Data Reported; -- = Not Applicable; NA = Not Available; W = Withheld to avoid disclosure of individual company data. |
| Release Date: 8/30/2024 |
| Next Release Date: 8/29/2025 |