|
Download Data (XLS File) |
|
||||||||
|
||||||||
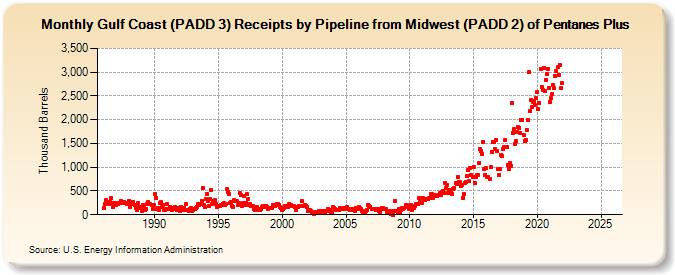
| Gulf Coast (PADD 3) Receipts by Pipeline from Midwest (PADD 2) of Pentanes Plus (Thousand Barrels) | ||||||||
| Year | Jan | Feb | Mar | Apr | May | Jun | Jul | Aug | Sep | Oct | Nov | Dec |
|---|---|---|---|---|---|---|---|---|---|---|---|---|
| 1986 | 144 | 221 | 300 | 256 | 258 | 231 | 274 | 344 | 257 | 166 | 251 | 255 |
| 1987 | 214 | 229 | 256 | 251 | 291 | 242 | 273 | 267 | 255 | 248 | 217 | 216 |
| 1988 | 291 | 158 | 272 | 224 | 277 | 202 | 138 | 108 | 243 | 156 | 135 | 168 |
| 1989 | 76 | 204 | 140 | 102 | 118 | 228 | 264 | 230 | 226 | 199 | 121 | 206 |
| 1990 | 435 | 358 | 110 | 148 | 103 | 239 | 277 | 172 | 212 | 92 | 100 | 127 |
| 1991 | 215 | 120 | 161 | 143 | 109 | 149 | 118 | 152 | 137 | 103 | 107 | 146 |
| 1992 | 83 | 155 | 96 | 92 | 136 | 218 | 91 | 95 | 83 | 125 | 137 | 86 |
| 1993 | 91 | 118 | 111 | 139 | 169 | 218 | 195 | 224 | 296 | 563 | 196 | 171 |
| 1994 | 323 | 439 | 292 | 176 | 325 | 522 | 229 | 291 | 282 | 301 | 223 | 168 |
| 1995 | 178 | 174 | 205 | 208 | 234 | 243 | 212 | 235 | 544 | 476 | 442 | 236 |
| 1996 | 278 | 186 | 167 | 304 | 293 | 281 | 205 | 241 | 455 | 419 | 183 | 236 |
| 1997 | 395 | 203 | 254 | 429 | 333 | 206 | 233 | 186 | 193 | 113 | 107 | 142 |
| 1998 | 159 | 117 | 108 | 106 | 119 | 152 | 174 | 179 | 163 | 179 | 165 | 123 |
| 1999 | 144 | 139 | 139 | 203 | 188 | 192 | 201 | 222 | 226 | 211 | 161 | 148 |
| 2000 | 105 | 117 | 143 | 176 | 188 | 152 | 220 | 205 | 200 | 190 | 174 | 188 |
| 2001 | 167 | 98 | 164 | 171 | 189 | 176 | 173 | 281 | 191 | 200 | 182 | 165 |
| 2002 | 86 | 89 | 90 | 72 | 63 | 30 | 25 | 41 | 63 | 63 | 60 | 74 |
| 2003 | 73 | 30 | 73 | 64 | 59 | 72 | 69 | 128 | 81 | 89 | 64 | 32 |
| 2004 | 154 | 148 | 111 | 95 | 97 | 104 | 133 | 113 | 118 | 118 | 148 | 128 |
| 2005 | 141 | 157 | 124 | 129 | 90 | 90 | 111 | 116 | 85 | 143 | 121 | 138 |
| 2006 | 157 | 138 | 113 | 71 | 40 | 51 | 47 | 76 | 109 | 211 | 179 | 170 |
| 2007 | 126 | 121 | 114 | 117 | 98 | 117 | 119 | 80 | 67 | 112 | 149 | 132 |
| 2008 | 128 | 129 | 113 | 48 | 61 | 75 | 22 | 53 | 2 | 87 | 279 | 76 |
| 2009 | 80 | 36 | 123 | 33 | 95 | 136 | 111 | 148 | 200 | 205 | 156 | 124 |
| 2010 | 166 | 203 | 107 | 131 | 132 | 191 | 229 | 222 | 224 | 360 | 260 | 245 |
| 2011 | 357 | 322 | 307 | 341 | 328 | 329 | 358 | 347 | 439 | 436 | 354 | 417 |
| 2012 | 406 | 390 | 404 | 415 | 449 | 422 | 480 | 501 | 457 | 670 | 565 | 621 |
| 2013 | 457 | 529 | 464 | 494 | 446 | 550 | 560 | 660 | 649 | 786 | 691 | 692 |
| 2014 | 602 | 631 | 362 | 437 | 677 | 689 | 812 | 936 | 704 | 993 | 833 | 786 |
| 2015 | 1,010 | 658 | 789 | 831 | 846 | 1,087 | 1,393 | 1,336 | 1,287 | 1,532 | 954 | 839 |
| 2016 | 974 | 787 | 787 | 759 | 997 | 1,328 | 1,533 | 1,537 | 1,386 | 1,570 | 1,344 | 958 |
| 2017 | 838 | 971 | 1,262 | 1,243 | 1,375 | 1,424 | 1,571 | 1,419 | 1,053 | 960 | 1,091 | 1,032 |
| 2018 | 2,343 | 1,725 | 1,796 | 1,492 | 1,542 | 1,733 | 1,839 | 1,834 | 1,725 | 1,993 | 1,994 | 1,687 |
| 2019 | 1,552 | 1,566 | 1,789 | 1,988 | 2,993 | 2,175 | 2,410 | 2,272 | 2,379 | 2,397 | 2,301 | 2,454 |
| 2020 | 2,576 | 2,228 | 2,357 | 3,073 | 2,698 | 2,622 | 3,097 | 2,595 | 2,837 | 2,966 | 3,075 | 2,657 |
| 2021 | 2,373 | 2,454 | 2,544 | 2,726 | 2,656 | 2,925 | 3,016 | 3,102 | 2,946 | 3,158 | 2,670 | 2,773 |
| 2022 | -- | -- | -- | -- | -- | -- | -- | -- | -- | -- | -- | -- |
| 2023 | -- | -- | -- | -- | -- | -- | -- | -- | -- | -- | -- | -- |
| 2024 | -- | |||||||||||
| - = No Data Reported; -- = Not Applicable; NA = Not Available; W = Withheld to avoid disclosure of individual company data. |
| Release Date: 3/29/2024 |
| Next Release Date: 4/30/2024 |