|
Download Data (XLS File) |
|
||||||||
|
||||||||
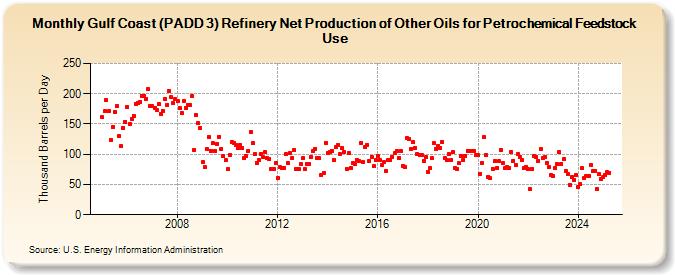
| Gulf Coast (PADD 3) Refinery Net Production of Other Oils for Petrochemical Feedstock Use (Thousand Barrels per Day) | ||||||||
| Year | Jan | Feb | Mar | Apr | May | Jun | Jul | Aug | Sep | Oct | Nov | Dec |
|---|---|---|---|---|---|---|---|---|---|---|---|---|
| 2005 | 161 | 171 | 190 | 171 | 123 | 145 | 170 | 180 | 130 | 113 | 144 | 154 |
| 2006 | 178 | 150 | 159 | 164 | 183 | 185 | 186 | 197 | 197 | 192 | 207 | 180 |
| 2007 | 179 | 177 | 173 | 183 | 167 | 172 | 192 | 182 | 205 | 194 | 184 | 191 |
| 2008 | 188 | 177 | 168 | 188 | 176 | 182 | 182 | 196 | 107 | 165 | 151 | 144 |
| 2009 | 87 | 79 | 108 | 129 | 106 | 118 | 106 | 117 | 129 | 109 | 97 | 90 |
| 2010 | 75 | 99 | 120 | 118 | 116 | 110 | 116 | 110 | 93 | 97 | 106 | 137 |
| 2011 | 118 | 100 | 86 | 90 | 100 | 95 | 103 | 93 | 92 | 76 | 75 | 86 |
| 2012 | 61 | 79 | 78 | 78 | 100 | 85 | 102 | 94 | 107 | 75 | 76 | 84 |
| 2013 | 93 | 75 | 84 | 84 | 96 | 105 | 109 | 94 | 93 | 65 | 69 | 119 |
| 2014 | 102 | 103 | 106 | 91 | 112 | 116 | 100 | 110 | 104 | 76 | 102 | 78 |
| 2015 | 85 | 84 | 91 | 88 | 119 | 87 | 112 | 116 | 88 | 96 | 80 | 90 |
| 2016 | 97 | 90 | 83 | 87 | 73 | 91 | 90 | 95 | 102 | 105 | 93 | 105 |
| 2017 | 81 | 79 | 127 | 125 | 109 | 120 | 110 | 100 | 99 | 98 | 89 | 95 |
| 2018 | 70 | 77 | 93 | 118 | 108 | 114 | 110 | 120 | 94 | 90 | 100 | 90 |
| 2019 | 103 | 78 | 76 | 85 | 97 | 91 | 97 | 106 | 106 | 105 | 106 | 99 |
| 2020 | 98 | 68 | 86 | 128 | 99 | 63 | 60 | 76 | 88 | 77 | 88 | 107 |
| 2021 | 85 | 77 | 79 | 77 | 104 | 89 | 83 | 100 | 96 | 91 | 77 | 79 |
| 2022 | 75 | 42 | 76 | 97 | 96 | 89 | 108 | 94 | 95 | 86 | 79 | 66 |
| 2023 | 63 | 77 | 84 | 104 | 84 | 92 | 72 | 68 | 49 | 62 | 58 | 65 |
| 2024 | 46 | |||||||||||
| - = No Data Reported; -- = Not Applicable; NA = Not Available; W = Withheld to avoid disclosure of individual company data. |
| Release Date: 3/29/2024 |
| Next Release Date: 4/30/2024 |