|
Download Data (XLS File) |
|
||||||||
|
||||||||
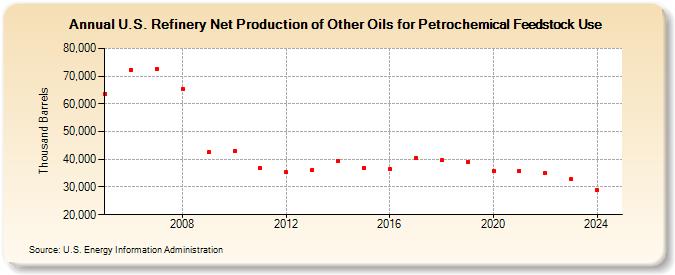
| U.S. Refinery Net Production of Other Oils for Petrochemical Feedstock Use (Thousand Barrels) | ||||||||
| Decade | Year-0 | Year-1 | Year-2 | Year-3 | Year-4 | Year-5 | Year-6 | Year-7 | Year-8 | Year-9 |
|---|---|---|---|---|---|---|---|---|---|---|
| 2000's | 63,662 | 72,311 | 72,629 | 65,502 | 42,485 | |||||
| 2010's | 42,977 | 36,916 | 35,265 | 36,220 | 39,448 | 36,964 | 36,399 | 40,620 | 39,610 | 39,121 |
| 2020's | 35,857 | 35,815 | 34,943 | 32,354 |
| - = No Data Reported; -- = Not Applicable; NA = Not Available; W = Withheld to avoid disclosure of individual company data. |
| Release Date: 3/29/2024 |
| Next Release Date: 8/30/2024 |