|
Download Data (XLS File) |
|
||||||||
|
||||||||
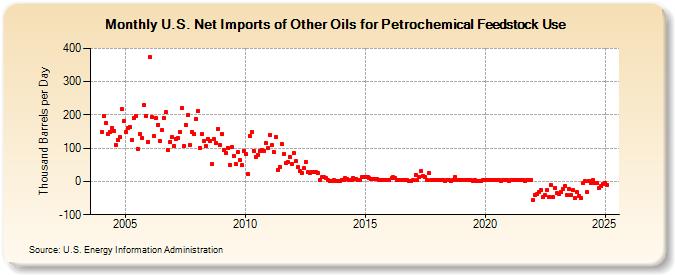
| U.S. Net Imports of Other Oils for Petrochemical Feedstock Use (Thousand Barrels per Day) | ||||||||
| Year | Jan | Feb | Mar | Apr | May | Jun | Jul | Aug | Sep | Oct | Nov | Dec |
|---|---|---|---|---|---|---|---|---|---|---|---|---|
| 2004 | 150 | 197 | 176 | 142 | 150 | 160 | 152 | 111 | 126 | 134 | 218 | 181 |
| 2005 | 150 | 160 | 164 | 126 | 190 | 197 | 99 | 142 | 132 | 230 | 198 | 120 |
| 2006 | 373 | 194 | 137 | 190 | 171 | 121 | 154 | 192 | 208 | 95 | 118 | 133 |
| 2007 | 107 | 128 | 130 | 148 | 222 | 108 | 170 | 201 | 109 | 148 | 142 | 187 |
| 2008 | 212 | 100 | 143 | 122 | 106 | 127 | 123 | 51 | 127 | 115 | 159 | 109 |
| 2009 | 143 | 96 | 86 | 101 | 50 | 103 | 77 | 51 | 88 | 63 | 48 | 93 |
| 2010 | 84 | 21 | 137 | 148 | 93 | 74 | 80 | 93 | 95 | 91 | 117 | 100 |
| 2011 | 141 | 109 | 90 | 133 | 35 | 43 | 113 | 84 | 56 | 59 | 75 | 52 |
| 2012 | 85 | 60 | 42 | 30 | 26 | 39 | 59 | 27 | 26 | 27 | 28 | 27 |
| 2013 | 25 | 4 | 12 | 12 | 11 | 3 | 2 | 2 | 3 | 1 | 2 | 1 |
| 2014 | 4 | 3 | 9 | 7 | 5 | 3 | 11 | 6 | 4 | 3 | 12 | 12 |
| 2015 | 12 | 13 | 9 | 7 | 6 | 7 | 6 | 4 | 3 | 5 | 3 | 4 |
| 2016 | 3 | 9 | 12 | 11 | 4 | 3 | 5 | 3 | 3 | 3 | 2 | 1 |
| 2017 | 3 | 20 | 4 | 13 | 32 | 16 | 14 | 4 | 25 | 4 | 5 | 3 |
| 2018 | 3 | 3 | 5 | 3 | 2 | 3 | 3 | 2 | 4 | 13 | 3 | 4 |
| 2019 | 4 | 3 | 4 | 4 | 3 | 3 | 2 | 3 | 2 | 2 | 2 | 3 |
| 2020 | 3 | 3 | 3 | 4 | 3 | 5 | 3 | 4 | 2 | 4 | 4 | 4 |
| 2021 | 2 | 5 | 3 | 3 | 4 | 4 | 3 | 5 | 2 | 3 | 3 | 4 |
| 2022 | -56 | -40 | -38 | -32 | -26 | -47 | -42 | -25 | -46 | -11 | -48 | -19 |
| 2023 | -36 | -37 | -31 | -22 | -14 | -41 | -22 | -41 | -27 | -50 | -33 | -45 |
| 2024 | -50 | -5 | 0 | -32 | 2 | -5 | ||||||
| - = No Data Reported; -- = Not Applicable; NA = Not Available; W = Withheld to avoid disclosure of individual company data. |
| Release Date: 8/30/2024 |
| Next Release Date: 9/30/2024 |